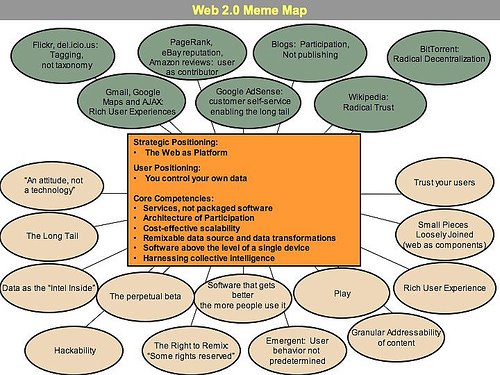
Caption: "There's an implicit 'architecture of participation', a built-in ethic of cooperation, in which the service acts primarily as an intelligent broker, connecting the edges to each other and harnessing the power of the users themselves. . . . [W]e believe that Web 2.0 will provide opportunities to beat the competition by getting better at harnessing and interpreting services provided by others. . . . [U]sers pursuing their own 'selfish' interests build collective value as an automatic byproduct." [Both the Web 2.0 Meme Map (diagram to left) and quotes (above) come from Tim O'Reilly's insightful article, "
What Is Web 2.0?," dated Sep. 30, 2005.]
The current buzz surrounding Web 2.0 revolves around the tremendous social networking potential that a community of users brings to the Internet, with the likes of MySpace, Flickr and Wikipedia captivating collective mindshare. Measured in economic terms, we can speak of utility or economic value generated by the network connectivity that Web platforms enable. How may we understand the value being created by this network?
The growth of technology and, more specifically, the Internet has rapidly changed the financial landscape: Microsoft's shrink-wrapped software sales minted thousands of millionaires over the past two decades. Yahoo's Web services turned its founders into billionaires. And less than two years after Google's IPO, its AdSense service has catapulted its founders onto the rarified list of deca-billionaires. If our world operates under Kurzweil's
law of accelerating returns, it is natural to state that the value-creation game is just getting started, with the the best and biggest yet to come (or, as the old saying goes, "You ain't seen nothing yet!"). Social networking and Web 2.0 are certainly "just" another growth stage among many--with still more profound surprises to follow. Below I provide my assessment of how the value of the network scales with connectivity as our technocentric world advances.
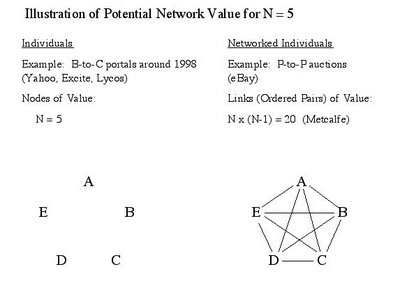
Back in 1998 when eBay went public with its auction platform built on its enviably "clean," no-need-to-touch-the-merchandise business model, the investment community experienced a remarkable rendition of
Metcalfe's law in action. We understood eBay's stellar success and speed to profitability in terms of "the power of the network," through which the number of pairwise linkages between nodes (individual participants) scales not linearly with number of participants (N) but quadratically as N-squared (N
2). For each of N sellers, there are N-1 potential buyers, giving a total of N x (N-1) possible buyer-seller pairings. For example, in the case of five individual participants (N = 5), the economic value of the network in not proportional to just five PCs running five copies of Windows OS and IE to browse B-to-C portal sites like Yahoo, Excite and Lycos circa 1998; instead, much greater value comes from all of the 5 x 4 = 20 potential buyer-seller pairings that eBay's P-to-P auction platform enables. See the connected chord diagram to the right in the figure below for the standard graphical representation of this five-participant network.
About a year following eBay's IPO,
David P. Reed published a
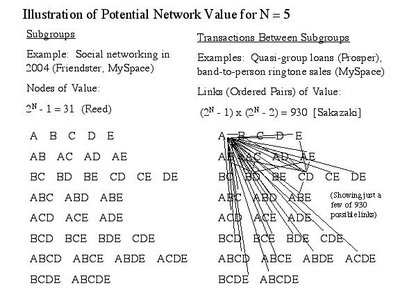
paper in which he discussed how the value of a network is rooted in more than just the pairwise transactions between individuals, pointing out the additional value in the group affiliations of individuals. Now called
Reed's law, this principle asserts that the value of a network scales as the number of potential subgroups of individuals comprising the network. A straightforward combinatorics exercise (summing up binomial coefficients) gives 2
N - 1 as the total number of subgroups, including one-person subgroups and ignoring only the trivial null set (i.e., the empty subgroup with nobody in it). Our example for N = 5 gives 2
5 - 1 = 31 subgroups, as shown in the diagram to the left of the figure below. Note that for all positive integers N, Reed's law produces more potential sources of value than Metcalfe's law does, i.e., 2
N - 1 (Reed) is always greater than N x (N-1) (Metcalfe).
Reed's law helps us understand why Rupert Murdoch's News Corp. paid $580 million last July to buy Intermix, owner of youth-oriented social networking site, MySpace. Recent
market commentary surrounding an offer to buy the less trafficked college-oriented social networking site, Facebook, indicates that Murdoch's purchase of MySpace, now ranked fifth in Internet traffic among
all English language sites (trailing only Yahoo, Google, MSN and eBay, according to
Alexa), may have been the "
purchase of the century." From the commentary, we can infer that the current market value of MySpace (a private company) is most likely at least a few billion dollars, with value coming from the myriad group affiliations so readily enabled by the MySpace platform.
Now, Metcalfe's law focusses on transactions between individuals and Reed's law counts the number of possible subgroups (i.e., group affiliations). What happens if we combine these two ideas and start to examine the potential for
transactions between subgroups? In other words, let's consider a "meta-level" that arises when we allow all of the subgroups themselves not just to co-exist in affiliations but actively to interact with each other. We can enumerate the potential scale of the network as follows: For pairwise (two-party) interactions between the 2
N-1 subgroups, we have (2
N-1) x (2
N-2) potential transactions, which scales as 2
N x 2
N, or 2
2N. More generally, we can also sum up the number of all three-party, four-party and higher-order, multiple-party transactions (again using combinatorics of binomial coefficients) to arrive at the formula 2
2N-1 - 1, which scales as 2
2N. Importantly, notice how the exponent itself is a rapidly growing exponential function! Plugging in numbers for our example with N = 5, we have: 31 x 30 = 930 potential two-party transactions, and a much, much larger number (2
31 - 1 = 2,147,483,647) of potential multiple-party transactions.
(I point out that multiple-party transactions are fairly common among traditional financial institutions and their customers. A three-party example at the retail level is a guaranteed loan involving borrower, lender and guarantor. A three-party example at the institutional level is a bond issuance in the capital markets involving issuer, investor and swap counterparty. When a fourth party is added to guarantee the swap, a four-party transaction results.)
To summarize the scaling properties of the different network components discussed above:
1.
Invididuals: The number of individual members scales linearly as N.
2.
Networked Individuals: The number of pairwise transactions between individuals scales quadratically as N
2 (Metcalfe's law).
3.
Subgroups: The number of subgroups (group affiliations) scales exponentially as 2
N (Reed's law).
4.
Transactions Between Subgroups: The number of interactions or transactions between subgroups brings us to a meta-level, scaling as 2
2N for two-party transactions and more generally as 2
2N for the totality of multiple-party transactions. [I take the liberty to assign tentatively my own last name (Sakazaki) to this component of value, since I have not run across any explanation of this type of network value elsewhere in print. If any reader is aware of a prior exposition, please let me know--of course, credit should be given where credit is due.]
We can assemble the above components into a network value equation:
Value = aN + bN
2 (Metcalfe) + c2
N (Reed) + d
pair2
2N + d
multi2
2N [Sakazaki],
where a, b, c, d
pair and d
multi are constants.
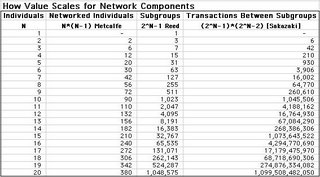
The table to the right shows how the above four components of network value grow as the size of the network increases. For the fourth (transactions between subgroups) component, I calculate using only lowest order (two-party) transactions, which suffices to display the spirit of the analysis. For N = 10 individuals, the scaling is N
2 = 100 transactions between paired individuals, 2
N = 2
10 (approximately a thousand) subgroups, and 2
2N = 2
20 (approximately a million) transactions between subgroups--i.e., 10 vs. 100 vs. 1,000 vs. 1,000,000. Observe how for N = 20, the fourth component (i.e., the meta-level) becomes even more significant: 20 vs. 400 vs. a million vs. a trillion!
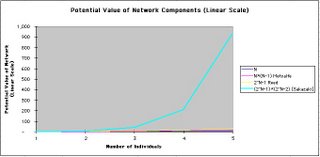
The graph to the right illustrates on a linear scale how the four components of value compare to one another. I plot the graph only through N = 5 to allow all four components of value to be visible. Even here, however, it is already very difficult to discern the first three (individual, networked individuals and subgroups) components of value, since the fourth component (number of transactions between subgroups) is overwhelmingly larger.
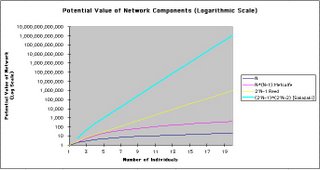
Plotting results on a logarithmic scale allows us to see all four components of value on the same graph. Clearly, for large networks (large N), the value of the network is dominated by all of the possible interactions and transactions between all of the possible subgroups. This interaction potential embodies the richness of the Web that is just beginning to be tapped by new platforms that facilitate transactions between subgroups having a Web presence.
Two recently launched examples reveal a surfacing of the "tip of the iceberg" of growth potential.
Prosper, a new online marketplace for people-to-people lending that launched in February, allows individuals to join borrower groups and post borrowing needs that are filled by multiple individual lenders through a reverse Dutch auction process. In the language of transactions between subgroups, individual borrowers leverage their group affiliations to transact with ad hoc groups of individual lenders via the Prosper platform. Also of note is the
announcement last week of the arrangement between Cingular, InfoSpace and MySpace to enable bands (music groups) to post ringtones for sale to other MySpace members through the bands' MySpace profile pages. Here, we have bands (subgroups) transacting with multiple individuals via the MySpace platform.
As the build-out of Web 2.0 with its abundance of user-generated and user-edited personal content continues, we should expect to see still richer interactions between freely forming subgroups enabled by Web platforms. I believe that this (inevitable, in my opinion) trend will lead to near-term value creation that is far greater than anything yet seen. If even only a small fraction of the 2
2N possible transactions among subgroups come to life through Web enablement, we will already see very substantial new value creation. The next few years should give rise to a whole new wave of meta-level value creation--bigger than anything Microsoft, Yahoo, eBay, Google and MySpace have managed to deliver to date. Indeed, we live in extremely exciting times!
 (Map Credit) Venture capital invested as a percentage of gross metropolitan product.