Taming Fat Tails for Fatter Profits
 “[The] Fat-tailed gecko . . . is adapted to a far different life-style. . . . It is a relatively docile animal, more shy and with different behavior patterns toward humans. . . . A new owner may cause the animal some distress, but upon becoming used to its owner, the Fat-tailed gecko is usually content to rest on a hand or arm.” (Source: www.familyzoo.us)
As in the picture of the fat-tailed gecko above, “fat tails” in finance tend to occur in pairs. In its most popular rendition, distributions of stock returns, the upper tail represents the persistence of abnormally high profits, occurring with a frequency significantly higher than can be attributed to random chance alone. At the other end of the distribution, the lower tail embodies what we all wish to avoid, persistently below-market returns.
Fat-Tailed Stock Returns
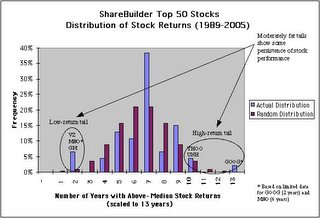 Taking the ShareBuilder Top Stocks cited in my prior post as an example, I plot the return distribution (price data from Yahoo Finance) of the 50 stocks on the list over the 16-year period from 1989 to 2005. Observe how the actual distribution is characteristically leptokurtotic (having a slender body and fat tails) compared to the random or “normal” distribution. (To facilitate comparison between fat-tailed and normal distributions, I calculate annual returns, assign percentile rankings each year across all stocks, and tally up the number of years that a particular stock exceeds that year's median annual return. I scale the number of years to the 13-year average of the 50-stock universe to bring long (e.g., Exxon with 16 years of data) and short (e.g., Yahoo with six years of data) stock price histories onto the same footing for analysis.)
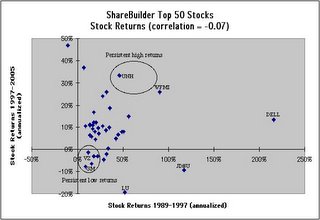 The behavior behind the fat tails is the tendency for a few of the stocks in the universe to exhibit persistent price movement. For example, for the eight-year period, 1989-1997, UnitedHealth (UNH) sported 46% annualized returns, followed by almost-as-impressive 33% returns for the next eight years, 1997-2005, placing the stock solidly in the high-return tail of the distribution. On the other hand, General Motors (GM) and Verizon (VZ) have shown persistently poor returns, banishing these stocks to the low-return tail.
Even Fatter-Tailed EPS Growth
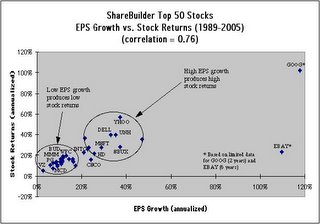 As investors, our interest in fat tails is in figuring out how to identify beforehand which stocks will occupy prominent positions on the proverbial upper fat-tail podium at the winning-stocks award ceremony a few years down the road. We all know that strong earnings drive stock prices higher, as shown in the scatter plot to the right. This is one of the few relationships in investing that has high reliability, with the correlation between EPS growth (data from Value Line) and concurrent stock returns approaching 0.8. Over the past 10 or 15 years, stocks with high EPS growth (exceeding 20% per annum), like Yahoo (YHOO), Starbucks (SBUX), UnitedHealth (UNH), Dell (DELL), Microsoft (MSFT) and Home Depot (HD), have produced high investment returns. Similarly, stocks at the low end of EPS growth (in the lower range of just 3% to 13% per annum), like Verizon (VZ), 3M (MMM), Anheuser-Busch (BUD), McDonald’s (MCD) and Procter & Gamble (PG), have generated low returns.
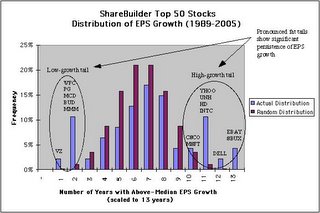 Knowing that EPS growth and stock returns are tightly correlated, we should take a look at the distribution of EPS growth, to see if fat tails appear here as well. Using the same methodology as for stock returns, I plot in the bar chart to the right the distribution of EPS growth for the 50 stocks on the ShareBuilder Top Stock list. The result is even more striking than for stock returns—the fat tails of the EPS growth distribution are noticeably fatter than the tails of the stock return distribution, showing that EPS growth is more persistent than stock returns. (Note: Part of the upper fat tail is comprised of stocks like eBay and Yahoo which have shorter stock trading histories, making it easier to obtain a perfect or near-perfect record of above-median performance during the full 13-year scaled term of the analysis. However, other stocks in the upper fat tail, like UnitedHealth, Home Depot and Intel, have trading histories spanning all 16 years of our analysis. I have performed the same analysis using the 30 components of the Dow Jones Industrial Average and other stock portfolios, and have found fat-tail EPS growth to persist here as well.)
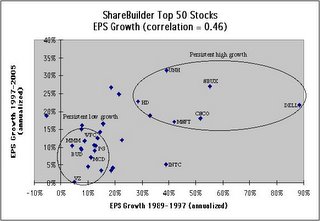 As with stock returns, a quick peek behind the curtain reveals what drives the fat tails of the EPS growth distribution. Stocks with high EPS growth (like Dell (DELL), Starbucks (SBUX), Cisco (CSCO), Microsoft (MSFT), UnitedHealth (UNH) and Home Depot (HD)) in the period 1989-1997 tend to continue to exhibit high EPS growth in the next eight-year period, 1997-2005. Similarly, stocks with low EPS growth (like Verizon (VZ) and others) in the first eight years continue to show low EPS growth in the next eight years. In many ways, this persistence of EPS growth (correlation of about 0.5 between front and back eight-year periods) in corporate financial performance is as we might expect based on parallels with, for example, how students receiving high grades in school one year tend to continue to achieve high grades in subsequent years, or how athletic ability and other talents tend to persist throughout an individual’s lifetime.
Persistent EPS Growth and Stock Returns
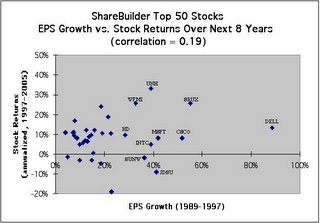 Now, if a) strong EPS growth in one period tends to be followed by strong EPS growth in subsequent periods, and b) EPS growth drives concurrent stock returns, might we use strong EPS growth in one period to help us predict which stocks will exhibit high returns in the next period? To check on the validity of this cause-and-effect relationship, I plot EPS growth during 1989-1997 against stock returns during the next eight years, 1997-2005. Note that the correlation is about 0.2, somewhat lower than for EPS growth vs. concurrent returns (correlation 0.8) and for back-to-back EPS growth (correlation 0.5), though still notably positive.
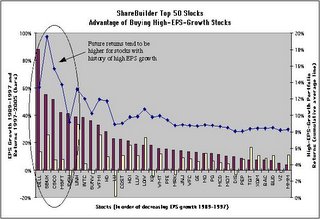 Just how significant is this correlation of 0.2? In other words, what is the implication for investment returns? Take a look at the chart to the right. Working our way across the ShareBuilder Top Stocks portfolio ranked left to right in the chart from highest to lowest historical EPS growth for the period 1989-1997, we can calculate cumulative averages of individual stock returns for the period 1997-2005. Notice how the cumulative-average line falls from left to right, indicating how stocks with histories of higher EPS growth tend to generate higher future investment returns. For example, if at the end of 1997 we had bought the top-10 high-EPS-growth stocks from 1989-1997, we would have realized stock returns averaging 11.7% per annum, versus the lower 8.3% for the entire portfolio.
Harnessing Low PEG to Do Even Better
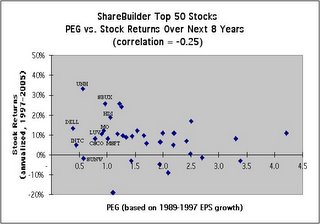 One pitfall of the buy-high-EPS-growth strategy is that stocks of rapidly growing companies often are very expensive, i.e., they trade at very high price-to-earnings (P/E) ratios, since everyone is trying to buy into their growth. We can improve our stock selection by taking into account both EPS growth rates and P/E through use of the ratio of P/E to EPS growth, or PEG. Then, instead of high EPS growth, we are interested in low PEG. The scatter plot to the right shows that PEG based on 1989-1997 earnings data and stock prices at the end of 1997 has a correlation of –0.25 to investment returns over the subsequent eight years, 1997-2005. Note that by taking into account the current price of the stock (the “P” in PEG), we are able to increase the magnitude (absolute value) of the correlation slightly.
 Proceeding with the same analysis used in the high-EPS-growth case, we can observe that stocks with lower PEG tend to produce higher future investment returns. A purchase at the end of 1997 of the top-10 low-PEG stocks from among the same ShareBuilder Top Stocks list used above would have generated an average return of 13.2% per annum for the period 1997-2005. The additional 150 basis point per annum pick-up over the 11.7% return from the top-10 high-EPS-growth stock portfolio comes from the slightly higher correlation between PEG and subsequent returns (in absolute value terms, 0.25, versus 0.2 for EPS growth and subsequent returns).
Aiming for Fatter Returns
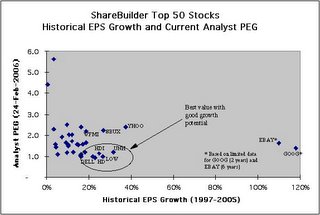 We are finally in a position to apply our results to enhance our chances of realizing better investment returns over the years ahead. The chart to the right shows members of the ShareBuilder Top Stocks list, classified across the two relevant parameters: EPS growth and PEG. For EPS growth, I use historical data from Value Line for the eight-year period, 1997-2005. For PEG, I use current numbers from Yahoo Finance, which are based on analyst consensus earnings estimates for the next five years and current P/E ratios.
At this time, the stocks on the list with the highest historical EPS growth and lowest PEG are: big-box home improvement retailer, Home Depot (HD); its competitor, Lowe’s (LOW); PC-maker, Dell (DELL); health care services giant, UnitedHealth (UNH); and heavyweight motorcycle-maker, Harley-Davidson (HDI). All of these stocks have historical EPS growth above 20% annually and PEG ratios near 1.0. Also of interest may be Google (GOOG) and eBay (EBAY), with triple-digit historical EPS growth rates and relatively attractive PEG ratios around 1.5, corresponding to current 23% (Google at 365 vs. high of 475 in January) and 32% (eBay at 40 vs. high of 59 in December 2004) price discounts from their all-time highs. Yahoo (YHOO), Starbucks (SBUX) and Whole Foods (WFMI) look appealing from the perspective of high EPS growth; however, their relatively high PEG ratios (all above 2.0) lead me to believe that better value resides in the other stocks cited.
To the extent that fat EPS growth tails continue to produce fatter-than-normal future stock returns, as they apparently have over the past 10 to 15 years, we can expect to realize above-average returns by buying stocks of companies with high historical EPS growth at relatively attractive, low-PEG prices.
Back to our lizard analogy . . . In the spirit of the proud owner of a once-timid, now-tamed fat-tailed gecko resting contentedly in the palm of its owner’s hand, may you too one day bask under rich, warm skies with fat-tailed profits lining your pocketbook!


92 Comments:
Hi Lloyds,
I have a big-question. Can we do ain investment based on high % of EPS? I want to invest in one of the Bank whose share is at 85 INR. For last 3 years it has 15% as EPS year. So does that mean, if it follows the same trend, then in 6 years, will I be able to receive my initial invest through EPS? Will all the EPS deposited in my bank accounts?
Thanks,
ANIL, INDIA
shareinfoline technical analysts keeps there eyes on this bullish Indian stock market to provide best intraday and long term share market calls daily. Our trading tips covers NSE and BSE.
Check gainers,losers ,news, IPO ,Free tips,trading tricks and all new mutual funds.
We Provide Recommendations on Indian Shares & Commodities via SMS.We provide intraday and long term share market calls daily with Equal Emphasising on fundamental and on technicals aspects.
With regards
shareinfoline.com
ShareInfoline.com is the leading website in India providing recommendations on Indian Shares, Stocks & Commodities.
It Provides all its calls by way of SMS and gives more than 80% accurcay in results.
You can also check the Past Performance in our website www.shareinfoline.com
MAX PROFITS TRADING JUST NIFTY,NOTHING ELSE..!!
www.niftyviews.com
Hi Friends,we have high success rate in nifty calls,our testimonial is our clients with whom you can chat online in our
live chat.
We dont just trade, we create wealth.
Every small and big investors can make money through our nifty calls, trade from 2 to 20 lots to get huge profits
consistently.
We top it up with attractive rates which you will make up by just trading 1 call.
Yes, we are that confident of our calls.
Come online to our 24hrs free chatroom where 200++ members trade together at: www.niftyviews.com
Also check the performance before you suscribe at: http://tsrnifty.blogspot.com/
FOR PAYMENT DETAILS http://groups.google.com/group/STOCKRESEARCHER/web/payment-details
Join our Google group: http://groups.google.com/group/STOCKRESEARCHER
Add me on orkut for daily updates: http://www.orkut.com/Profile.aspx?uid=1619632468359550031
For free calls on your cell phone
SMS- JOIN Sresearchers and send to 567678
Or SMS ON Sresearchers to 09870807070
NSE and BSE have many listed stocks, Let Sharetipsinfo research best profitable stocks for you. Our accuracy speaks for us
Very good information you are providing at here , its really helps me a lot .
Thanks
Anjali
I like your article and it really gives an outstanding idea that is very helpful for all the people on web.
Thanks so much for this! I haven't been this moved by a blog for a long time! You’ve got it, whatever that means in blogging. Anyway, You are definitely someone that has something to say that people need to hear. Keep up the good work. Keep on inspiring the people!
regards:
Commodity Tips
very nice post sir.i just love it.thanks for sharing this with us.
for two days free trail pack please contact on 0731-4295950
Very good post, I was really searching for this topic, as I wanted this topic to understand completely and it is also very rare in internet, that is why it was very difficult to understand.
Thank you for sharing this.
regards:
Commodity tips
This is very nice blog. I just love this.for two days free trial pack in equity and commodity please contact us on 0731-4295950
If you are trading in NSE, BSE, MCX and in NCDEX then let sharegyan give you all stock trading gyan
If you are trading in NSE, BSE, MCX and in NCDEX then let sharegyan give you all stock trading gyan
If you are trading in NSE, BSE, MCX and in NCDEX then let sharegyan give you all stock trading gyan
If you are trading in NSE, BSE, MCX and in NCDEX then let sharegyan give you all stock trading gyan
If you are trading in NSE, BSE, MCX and in NCDEX then let sharegyan give you all stock trading gyan
Get Indian stock market tips covering cash tips, future tips, nifty trading idea, commodity and option trading tips
Get Indian stock market tips covering cash tips, future tips, nifty trading idea, commodity and option trading tips
If you are trading in NSE, BSE, MCX and in NCDEX then let sharegyan give you all stock trading gyan
If you are trading in NSE, BSE, MCX and in NCDEX then let sharegyan give you all stock trading gyan
Thanks so much for this! I haven't been this moved by a blog for a long time! You’ve got it, whatever that means in blogging. Anyway, You are definitely someone that has something to say that people need to hear. Keep up the good work. Keep on inspiring the people!
regards,
stock tips,commodity tips,nifty tips
The stock market rear in the former days, the proceedings of the international multinationals was habitually ripe, and fiscal intelligibility was almost missing. Rejection, we will not discus about the days gone bye maltreatments that showed the way to in the present day's developments. A lot of years afterward, a lot of of the alike fiscal monkeyshines conducted in a in the same way ever changing and developmental gesticulate of regulations and regulatory organizations which in a way showed the way to a lot of of the shareholder securities that we at the present undervalue. We should always have a look at the effect of the STOCK MARKET on the various sections of the society.
Equity shareholders
An adjustment in the modus operandi emblematic laymen examined the jeopardy of procuring stocks. Until that time, a miniature amount of equity shareholders had taken care of stocks a great deal in the vein of acquaintances, liking better the stocks with rigid material goods financial assistance each share and an incessant in addition pour out. Other than a violent flow of share market accomplishment legends in the intermediate news scenario revolutionized to facilitate, and as a result was brought to life the way of life of conjecture distinguished everywhere. This innovative outward appearance of thought was anchored in a on the increase enthusiasm to have possession of stock "numbered not by reason of dynamic positive features or what went before proceeds but on the likelihood of earnings to draw closer at a number of not mentioned tip in the outlook." In a smaller amount than an age band, stocks gained in size from being social establishment break offs for the affluent into reputable speculations for the working set. You need to make sure that you have a regular look at the sensex so that you can get the best idea when and where to invest in the stock market.
If you are trading in NSE, BSE, MCX and in NCDEX then let sharegyan give you all stock trading gyan
If you are trading in NSE, BSE, MCX and
in NCDEX then let sharegyan give you all stock trading
gyan
Thanks so much for this! I haven't been this moved by a blog for a long time! You’ve got it, whatever that means in blogging. Anyway, You are definitely someone that has something to say that people need to hear. Keep up the good work. Keep on inspiring the people!
mcx gold tips,crude tips,silver prices
If you are trading in NSE, BSE, MCX and in NCDEX then let sharegyan give you all stock trading gyan
Nice blog,
Just wondering what people think about current market situation?
Sharemarketzone is a network of various top stock market analyst who are posting their research at one place for the various stock market traders and investors for free
It is in point of fact a great and helpful piece of info. I am glad that you shared this useful information with us.Please stay us informed like this.Thanks for sharing.
This is one of the good articles you can find in the net explaining everything in detail regarding the topic. I thank you for taking your time sharing your thoughts and ideas to a lot of readers out there.
At the other end of the distribution, the lower tail embodies what we all wish to avoid,
dissertation sample
I was working and suddenly I visits your site frequently and recommended it to me to read also. The writing style is superior and the content is relevant. Thanks for the insight you provide the readers! Thanks for such an interesting article here.
Call Option || Option Tips || Stock Option Tips || Options || Nifty Options
nice post. Thanks for sharing.
I always like your blog post because you always comes with different ideas and information. I always shared your site post with my friends. Keep posting and i will follow you. best advisory company
This is so cool. I am such a huge fan of their work. I really am impressed with how much you have worked to make this website so enjoyable. stock market tips
I always like your blog post because you always comes with different ideas and information. I always shared your site post with my friends. Keep posting and i will follow you. <intraday tips
This is so cool. I am such a huge fan of their work. I really am impressed with how much you have worked to make this website so enjoyable. Forex tips
To get Super quality mcx tips in indian market visit our website
Commodity tips And Financial Astrology
Nice Blog, Keep posting
Thanks for sharing this with us. I found it informative and interesting. Looking forward for more updates..
Useful information shared. . I am very happy to read this article. Thanks for giving us nice info. Fantastic walk-through. I appreciate this post.
Great post. Thanks for sharing it.
Your site is fantastic. I’ve bookmarked your site in my browser; I hope in future days I’ll get more valuable information from your site.
Excellent tips. Really useful stuff .Never had an idea about this, will look for more of such informative posts from your side.. Good job...Keep it up
African fat-tailed geckos are nocturnal ground dwelling lizards that originate from desert areas in West Africa, from Senegal through Ghana and Togo all the way over to Cameroon. They are one of only a few species of geckos that have eyelids, which help keep their eyes clean in their dusty natural environment.
There is lot of articles on the web about this. But I like yours more, although i found one that’s more descriptive. Stock tips
Hi, I am also a commodity tips provider and I like to read and write article or blogs, mainly I read all blogs, it is my habit to collect information where ever I can, it will never waste ,today I caught your nice blog and it is written nicely with good content.....I appreciate it....
Daily Profit Tips||BSE Tips
Hi this one is great and is really a good post. I think it will help me a lot in the related stuff and is very much useful for me. Very well written I appreciate & must say good job..
Today indian share market is so fluctuating that it is very hard to work & earn money but some
companies giving really very good calls so that we can earn in this Share market. PowerofTrading.com is one of them. They are giving regular 5-7 calls with more than 98% accuracy. Go for Free Share Market Tips
Regards
POWEROFTRADING TEAM
You can go for Bux Website to start earning money visit Ninja Bux -
Earn Money through Bux Website
You can use the full Guide which guide you all - Neobux Guide
Hi this one is great and is really a good post. I think it will help me a lot in the Share Market Tips. Very well written I appreciate & must say good job..
Very nice post and well written content by writer giving beneficial information to traders. Keep posting stuff like that to grow our knowledge with your information.
Best stock tips provider in india
Trifid Research is an Indian share market advisory firm based in Indore, India. He has proven month after month that buying and selling and investing in the equity market can be profitable, whether market overall is bearish or bullish. Trifid Research facilitates its customer in their wealth creation procedure. It provides recommendations for Equity- Cash and F&O traded on the National Stock Exchange. It is a group of professionals with expertise in technical and fundamental analysis.
I like what you guys are up too. This type of clever work and reporting! Keep up the great works guys I've incorporated you guys to my own blogroll.
Stock Trading Tips
I just read through the entire article of yours and it was quite good. This is a great article thanks for sharing this informative information. I will visit your blog regularly for some latest post.
Regards
Stock Tips
wonderfull blog posting and designing, and really appreciate by your performance in the blog....keep it up
NSE BSE Live Calls
This is the perfect blog for anyone who wants to know about stock tips. It contains truly information. Your website is very useful. I admire the valuable advice you make available in your expertly written content. I want to thank you for this informative read; I really appreciate sharing this great.
Hello Blogger! First i would like to appreciate you fr sharing such an interesting blog. I like the way you presented this post along with such easily understandable diagrams. Looking forward for more info related indian stock tips
keep it up.
Thanks for supporting your time to post such an interesting & useful content.Great piece of writing, I really liked the way you highlighted some really important and significant points. Thanks so much, I appreciate your work.
Accurate Stock Tips
Being a financial adviser i appreciate your blog the way you are presenting this blog really good and informative too thanks for sharing such a nice blog.
We are really grateful for your blog post. You will find a lot of approaches after visiting your post.
Great work.
Such a very useful article. Very interesting to read this article.I would like to thank you for the
efforts you had made for writing this awesome article.
Sign in to Gmail to access to all Gooogle services. Log in to your account or sign up to create a new
account
gmail sign in
gmail log in
what's gmail?
slitherio
Tank trouble
happy wheels
Strike Force Heroes
In this game, you start at the cavern men's age, then evolve! There is a total of 5 ages, each with its
units and turrets. Take control of 16 different units and 15 different turrets to defend your base and
destroy your enemy.
age of war
We are really grateful for your blog post. You will find a lot of approaches after visiting your post.
Great work.
happy wheels
strike force heroes
earn to die
Fireboy and Watergirl arrived again to the temple in the forest. 2 players together can help them to find
their way out.
fire boy and water girl
Yes if forex keeps on showing this positive note then definitely India economy will be benefited from it. Traders also helps in improving country's economic condition but they should use good stock tips to earn their required returns as well.
I found it quiet interesting ,Thank you for posting the great content…I was looking for something like this…, hopefully you will keep posting such blogs…
MCX Premium Tips
جايب لكم مواقع شركات صيانة الاجهزة المنزلية شركة يونيون اير , وشركة سامسونج و شركة سيمنس دا المواقع المعتمدة من الشركات , انا دورت كتير لحد لم توصلت للمواقع دي
صيانة توشيبا
صيانة غسالات سامسونج
صيانة ثلاجات كريازي
صيانة ثلاجات توشيبا
صيانة سامسونج
صيانة توشيبا
صيانة غسالات توشيبا
صيانة ثلاجات توشيبا
صيانة سخانات سيمنس
صيانة غسالات كريازي
رقم صيانة سيمنس
اسعار تكييف يونيون اير
مبيعات يونيون اير
تكييف يونيون اير
Thank's for updates, for most related post
Free Share Market Tips
i am always looking to read this kind og blogs because i am providing Free MCX Gold Tips
Thanks for providing this unique and good information
List of best Punjabi songs
Thanks for sharing this amazing blog and the details about stock tips really awesome.
Best Stock Advisory Company
90% accurate commodity tips, equity tips, nifty tips, option trading tips, future tips for sure profit can be availed for free Intraday Market Tips
Thank's for updates, for most related post
Stock Cash Tips
Your blog post is best like that nifty, intraday stock tips thanks.
Stock cash tips
This site is good, simple and precise information. Images and font colors are amazing.
Stock cash tips
If you are unable to get good profit from the market, then Investment Visor helps them to make a big profit from the market.
Best stock tips
I'm very impressed by the detail of your blog posts. This is going to be very helpful. Thanks for sharing your thoughts.
Top 10 advisory firm in Indore
يمكنكم الحصول الان علي افضل الصيانات المتميزه الان من خلال موقعنا و الذي يعتبر صيانة باور الافضل في الصيانات الان و بافضل كفائه الان و اعلي مستوي من التميز من خلال موقعنا في الصيانات توكيل باور و الصيانات المنزليه تواصلو معنا الان
خصومات الان وباقل الاسعار الرائعة التى لا احد يقدمة الان من صيانة يونيون اير حيث اننا نعمل على تقدم افضل الخدمات المختلفة فى مصر والوطن الغربي توكيل يونيون اير لاننا نعمل على تقدم افضل الخدمات الرائعة الان فى مصر والوطن العربي باكمل فى جميع انواع الصيانة من خدمة عملاء يونيون اير الان فى مصر الان وباقل الاسعار الرائعة
الان افضل خدمات من كبري مراكز صيانة كاريير حيث انهم يعملون علي توفير الكثير من خدمات توكيل كاريير ويمكنم الاعتماد علي اكير مركز خدمة عملاء كاريير الذي يعمب علي صيانه الاجهزه الكهربائه الخاصه و الكبري
افضل الصيانات المتميزه الان من خلال موقعنا و الذي يعتبر الافضل في الصيانات صيانة كاريير المتميزه و بافضل كفائه الان من خلال موقعنا بصيانات جميع الاجهزه الكهربائيه الان و باقل توكيل كاريير الاسعار و افضل الخصومات المتميزه من موقعنا
استمتع الان بـ افضل الخدمات لـ صيانه المعدات من صيانة امريكول وذلك بـ احدث الاساليب من توكيل امريكول تواصل الان مع خدمة عملاء امريكول لـ طلب الخدمة
احصل علي فريق متخصص في توكيل كينوود في صيانه الاجهزه الكهربائيه من خلال اكبر مركز توكيل جونكر المميز في صيانه الاجهزه الكهربائيه من كبري مراكز الصيانه الكبري والعالميه في خدمات الصيانات الشامله للاجهزه
تواصل الان معنا مع افضل فريق من المتخصصون فى جميع انواع الصيانة الان فى مصر والوطن العربي خدمة عملاء تكنوجاز ويجد ايضا افضل واهم العروض الرائعة والمختلفة التى تقدمة الشركة الن حيث اننا نعمل على تقدم افضل طرق الصيانة الان فى جميع مركزنا بمصر والوطن العربي من صيانة بلاك اند ديكر وباقل التكاليف المختلفة التى نقدمة الان فى مصر والوطن العربي
الان و باقل الاسعار و افضل الخصومات المتميزه احصل الان علي افضل توكيل اريستون الصيانات المتميزه من خلال موقعنا و توفير افضل الصيانات توكيل امريكول المنزليه الان من خلال موقعنا الافضل الصيانات توكيل كاريير المنزليه الان من موقعنا تواصلو معنا
اليكم الان افضل الطرق لـ صيانه الاجهزه الكهربائية من صيانة يونيون اير وذلك بـ احدث التقنيات و الاساليب مع امهر الفنين لـ خدمات الفحص الدوري من صيانة ال جي تواصل الان معنا لـ طلب الخدمة
Useful information shared..I am very happy to read this article..thanks for giving us nice info.Fantastic walk-through. I appreciate this post..Best Mortgage Rates in Canada
Thanks for sharing these useful information! Hope that you will continue doing nice article like this.Best Mortgage Rate in Aurora
Excellent read, I just passed this onto a colleague who was doing a little research on that. And he actually bought me lunch because I found it for him smile So let me rephrase that.Best Mortgage Rate in Toronto
Nice post.I like the way you start and then conclude your thoughts. Thanks for this information .I really appreciate your work, keep it up.
Best Mortgage Rate in North bay
This is a really good read for me, Must admit that you are one of the best bloggers I ever saw.Thanks for posting this informative article.Best Mortgage Rate in Mississauga
Nice post.I like the way you start and then conclude your thoughts. Thanks for this information .I really appreciate your work, keep it up.Blended Mortgage
Nice post.I like the way you start and then conclude your thoughts. Thanks for this information .I really appreciate your work, keep it up.Best Mortgage Rate in Ottawa
Excellent read, I just passed this onto a colleague who was doing a little research on that. And he actually bought me lunch because I found it for him smile So let me rephrase that.Best Mortgage Rate in Pickering
This is a wonderful article, Given so much info in it, Thanks for sharing. The article is nice and its pleasant to read. Sharetipsinfo is known for providing highly accurate stock tips which covers Cash tips, F&O intraday tips, Nifty intraday tips, Mcx intraday commodity tips and Share market tips with high accuracy.
Amazing information you have shared with us. Everyone should read this. By Social Media App Development Cost
Post a Comment
<< Home