2005 Winners and Losers and a Stockpicking Clue for 2006
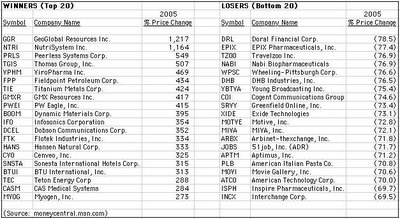
In stock investing, we all wish we had the foresight consistently to pick winners and avoid losers. According to Moneycentral's list for 2005, the top 20 performing stocks sported impressive returns ranging from 273% to 1217%, while the bottom 20 performers saw equally remarkable value destruction to the tune of 70% to 79%.

Clearly, investors who owned NutriSystem (NTRI) or Hansen Natural (HANS) during 2005 made out like a bandit, while anyone unfortunate enough to hold Travelzoo (TZOO) or Movie Gallery (MOVI) must wish they hadn't.
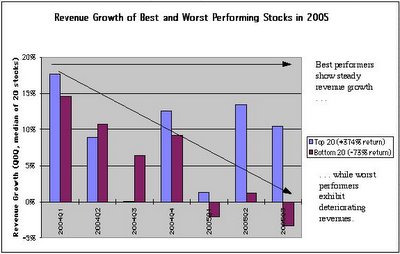
The million dollar question, of course, is: How do we pick winners and avoid losers? A first step to picking winners is understanding what distinguishes a winning stock from a losing one. Using data provided by Moneycentral, we can look at quarterly earnings and revenue growth for each of the top 20 and bottom 20 performing stocks from 2005. By focussing on the median earnings and revenue growth figures in each group, we arrive at results in line with expectations:
1. A typical stock in the best performing group shows accelerating earnings growth moving from 2004 into 2005, while, on the other hand, the worst performers exhibit sharply deteriorating earnings.

2. The best performers show steadily growing revenues from 2004 continuing into 2005, while the worst performers exhibit shrinking to negative revenue growth.

On the whole, the market responds rationally to earnings and revenue changes. Stocks with increasing revenues and accelerating earnings are bid up by investors, while those with deteriorating financial performance are shunned.
While this simple analysis is not a crystal ball for picking the winners in 2006, it does provide a clue as to where one might begin to look for excess returns. Referring again to the earnings graph, note that for a typical stock in the top-20 group, earnings are slightly negative to only slightly positive during the first three quarters of 2004. Then, in the fourth quarter of 2004, earnings suddenly zoom higher. This trend of accelerating earnings continues into 2005. Driven by accelerating earnings, stock prices of companies in this top-20 group rose spectacularly throughout 2005 to give multi-bagger returns for the year.
Though much easier said than done, here's a prescription for finding multi-baggers in 2006: Look for companies with growing revenues whose reported earnings are "on the cusp," having recently transitioned from negative to positive and with potential for explosive growth as revenues expand further. Risk can be managed by following a portfolio approach, i.e., buying a handful of these "on the cusp" stocks rather than placing all bets on one company.

Clearly, investors who owned NutriSystem (NTRI) or Hansen Natural (HANS) during 2005 made out like a bandit, while anyone unfortunate enough to hold Travelzoo (TZOO) or Movie Gallery (MOVI) must wish they hadn't.
The million dollar question, of course, is: How do we pick winners and avoid losers? A first step to picking winners is understanding what distinguishes a winning stock from a losing one. Using data provided by Moneycentral, we can look at quarterly earnings and revenue growth for each of the top 20 and bottom 20 performing stocks from 2005. By focussing on the median earnings and revenue growth figures in each group, we arrive at results in line with expectations:
1. A typical stock in the best performing group shows accelerating earnings growth moving from 2004 into 2005, while, on the other hand, the worst performers exhibit sharply deteriorating earnings.

2. The best performers show steadily growing revenues from 2004 continuing into 2005, while the worst performers exhibit shrinking to negative revenue growth.

On the whole, the market responds rationally to earnings and revenue changes. Stocks with increasing revenues and accelerating earnings are bid up by investors, while those with deteriorating financial performance are shunned.
While this simple analysis is not a crystal ball for picking the winners in 2006, it does provide a clue as to where one might begin to look for excess returns. Referring again to the earnings graph, note that for a typical stock in the top-20 group, earnings are slightly negative to only slightly positive during the first three quarters of 2004. Then, in the fourth quarter of 2004, earnings suddenly zoom higher. This trend of accelerating earnings continues into 2005. Driven by accelerating earnings, stock prices of companies in this top-20 group rose spectacularly throughout 2005 to give multi-bagger returns for the year.
Though much easier said than done, here's a prescription for finding multi-baggers in 2006: Look for companies with growing revenues whose reported earnings are "on the cusp," having recently transitioned from negative to positive and with potential for explosive growth as revenues expand further. Risk can be managed by following a portfolio approach, i.e., buying a handful of these "on the cusp" stocks rather than placing all bets on one company.


2 Comments:
Insightful post! Keep up the good work.
I would like to leave a stock recommendation the company bonso electonic the stock trades around 1.50 a share under the symbol BNSO
Post a Comment
<< Home