For How Long Can Google Run Ahead of the Pack?
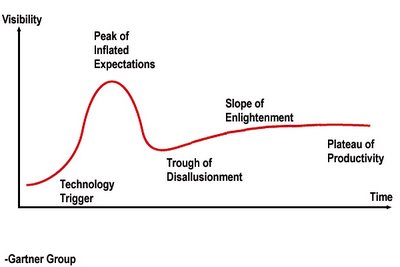
I came across the Gartner Group's "technology bubble" graph recently, sketching how "hype cycles" work:
1. A new technology reaches the market;
2. People's expectations become overly inflated as the technology is hyped;
3. Disillusionment soon sets in when we realize the limitations of the technology;
4. Ultimately, we are "enlightened" and reach a plateau of productivity.
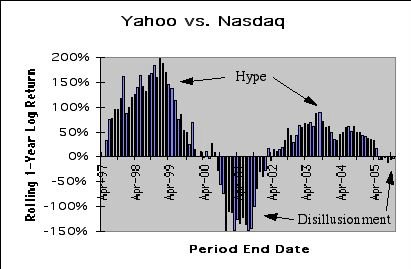
This type of overinflated expectations behavior can readily be seen in the stock market. A textbook example is Yahoo's stock price from its IPO in 1996, through the Internet stock craze of 1999, collapse of the bubble in 2000-2001, and more realistic expectations from 2002 onward:

To highlight the hype-disillusionment cycles embedded in the price information, I apply a three-part transformation to the raw data:
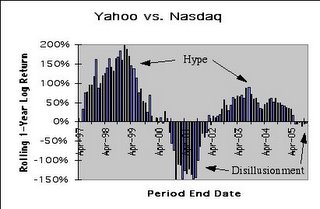
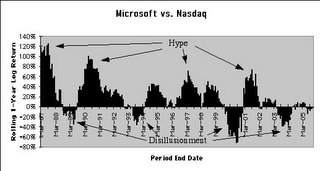
The lognormal excess return chart exhibits how the hype-disillusionment cycle repeats itself over time. These recurring cycles are more apparent in the price charts of stocks having longer trading histories, such as Microsoft's beginning with its IPO in 1986:
In the stock market, the mechanism underlying hype-disillusionment cycles is none other than what Ben Graham pointed out more than a half a century ago with his discussion of Mr. Market, whose emotions run from being overly enthusiastic one day to gloomy and depressed another day.
Following Google's IPO in August 2004, where in its own hype-disillusionment cycle does the company sit today? Due to its limited history as a public company, Google's cycle is difficult to quantify. However, a look at Google in relation to other Nasdaq companies provides some useful intuition:

Chronologically from the dates of their IPOs, these Nasdaq market leaders have given us:
As the comparative return graph indicates, among these companies, only Google has been so dramatically outperforming the Nasdaq over the past year. Based on the long history of hype-disillusionment cycles of all of the market leaders, we can be fairly certain that underperformance at Google will too (like night follows day) one day come. Personally, I would bet on convergence between Google and "the pack" of market leaders before becoming too carried away with notions of brilliant Ph.D. researchers leveraging algorithmic search to leapfrog into mainstream advertising, journalism, shopping and the like.
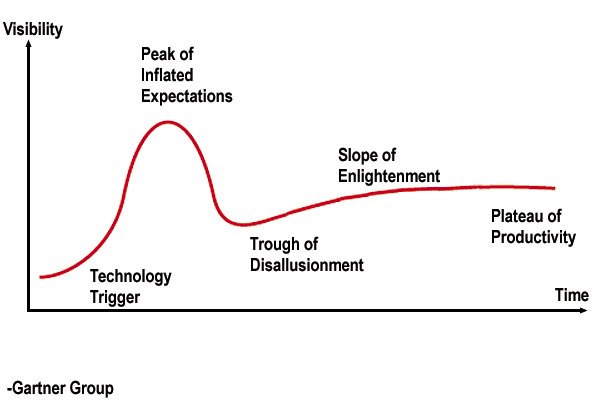
1. A new technology reaches the market;
2. People's expectations become overly inflated as the technology is hyped;
3. Disillusionment soon sets in when we realize the limitations of the technology;
4. Ultimately, we are "enlightened" and reach a plateau of productivity.
This type of overinflated expectations behavior can readily be seen in the stock market. A textbook example is Yahoo's stock price from its IPO in 1996, through the Internet stock craze of 1999, collapse of the bubble in 2000-2001, and more realistic expectations from 2002 onward:

To highlight the hype-disillusionment cycles embedded in the price information, I apply a three-part transformation to the raw data:
- Look at annual returns using a rolling 12-month observation window to "smooth out" short-term volatility;
- Use a lognormal scale [Lognormal Return = ln(1 + Ordinary Return)] to display upside and downside more symmetrically;
- Calculate excess returns above the Nasdaq stock index to gauge individual stock outperformance.
The lognormal excess return chart exhibits how the hype-disillusionment cycle repeats itself over time. These recurring cycles are more apparent in the price charts of stocks having longer trading histories, such as Microsoft's beginning with its IPO in 1986:

In the stock market, the mechanism underlying hype-disillusionment cycles is none other than what Ben Graham pointed out more than a half a century ago with his discussion of Mr. Market, whose emotions run from being overly enthusiastic one day to gloomy and depressed another day.
Following Google's IPO in August 2004, where in its own hype-disillusionment cycle does the company sit today? Due to its limited history as a public company, Google's cycle is difficult to quantify. However, a look at Google in relation to other Nasdaq companies provides some useful intuition:
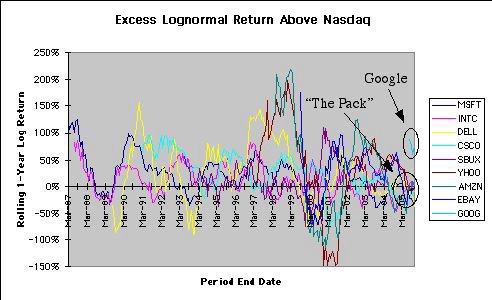
Chronologically from the dates of their IPOs, these Nasdaq market leaders have given us:
- Microsoft (1986): Windows operating system and Office productivity applications
- Intel (1986): Chips to run the software
- Dell (1988): Affordable PCs for everyone
- Cisco (1990): Networking equipment for the Internet
- Starbucks (1992): (To round out the online experience) Coffee, couches and conversation
- Yahoo (1996): Content with a human touch and sense of online community
- Amazon (1997): More than just books--the Wal-Mart of the web
- eBay (1998): Auctions allowing anyone to sell anything
- Google (2004): Clean, fast, automated, algorithmic search
As the comparative return graph indicates, among these companies, only Google has been so dramatically outperforming the Nasdaq over the past year. Based on the long history of hype-disillusionment cycles of all of the market leaders, we can be fairly certain that underperformance at Google will too (like night follows day) one day come. Personally, I would bet on convergence between Google and "the pack" of market leaders before becoming too carried away with notions of brilliant Ph.D. researchers leveraging algorithmic search to leapfrog into mainstream advertising, journalism, shopping and the like.
posted by Lloyd Sakazaki at 11:07 AM
![]()
![]()


6 Comments:
I totally agree with your opinion on goog. Unfortunately, personally, loosing big on being against the crowd.
I agree completely. Check an analysis of GOOG from a chartists perspective at.....
http://stockchartist.blogspot.com/2005/11/chartists-opinion-on-google-goog.html
I have to read more on this tech bubble concept and its application to Indian markets. Nice tie-in of examples to the concept.
Hi, nice blog.. If you would this blog get to known by people please submit it to our directory. It is new directory and it will expose your web better if you were the first (It's free!). Here is the url http://www.webkios.info/link_exchange_directory
Who knows where to download XRumer 5.0 Palladium?
Help, please. All recommend this program to effectively advertise on the Internet, this is the best program!
I have a web site where I research stocks under five dollars . I have many years of experience with these type of stocks. I can not believe that apple computers shares traded at just 5 dollars in 1998 the stock trades at 450 dollars a share today. Their are many stocks trading today that once traded under 5 dollars. This is just one of many examples.
Post a Comment
<< Home