Wednesday, November 29, 2006

What 2000 Years of History Tells Us About China's Economic Future

Photo credit

For a day-trader, a few weeks can seem like an eternity. For a speculator, a few months is an extended holding period. For an investor, a few years is considered long-term. For making a fortune, a few decades (plus perseverence, timely decision-making and good luck) are typically required. For us Americans, a few centuries is what we mean by "history." However, if we want to understand our own economic future, we really should look back much further in time--a couple of millennia, in fact--to develop the proper perspective.

Two Thousand Years of Economic History

Angus Maddison is a pioneeering macro economist who has devoted his academic career to studying the history of global economic growth. Adopting a quantitative framework, he has assembled GDP numbers that help us understand the impact of technology on civilization, going as far back as the historical record permits.
Based on the results of Professor Maddison's research, incorporating purchasing power parity (PPP) adjustments, the graph to the right shows how the contributions of various countries and regions to world GDP have shifted over the past two thousand years:

1 A.D.: In the first year of the Gregorian calendar, China and India represented the economic center of the world, together commanding 57% of the world's GDP. At this time, with the Roman Empire approaching its prime, Western Europe accounted for a lesser 14% of the world's GDP. By contrast, the American continents remained as yet largely "undiscovered," deserving little more than a footnote in the annals of world economic history;

1500-1700 A.D.: A full millennium and a half later, the post-Renaissance period with its Age of Enlightenment vaulted Western Europe to new cultural and economic heights, allowing Europe's GDP to catch up to China and India's;

1820-1900 A.D.: The Second Industrial Revolution of the 19th century carried Western Europe's GDP even higher, and also catalyzed the rapid rise of the U.S. as an important economic power.

1950 A.D.-present: Western Europe and its "offshoot" (Maddison's terminology) U.S. economy represented about 54% of the world's GDP in 1950, but this combined percentage has fallen over the past few decades to about 40% where it sits today. Following on the coattails of Japan's economic growth spurt in the post-World War II years between 1950 and 1990, China (and India, though at a more moderate pace) has begun to rise again. Through accelerated growth, China's economy has gone from representing just 4% to 5% of the world's GDP in the decades (1949-1976) of Chairman Mao's rule to more than 15% today.

Of course, much of reason for China and India's dominant share of world GDP a millennium or two ago was the sheer size of their headcount (acknowledging, too, that favorable economic conditions allow populations to grow). Up until the mid-1800s, China and India each represented between 20% and 35% of the world's population; in other words, the majority of the people in the world lived in either China or India. As the populations of Africa, Latin America and certain other regions of the world have grown at faster rates over the past century, today China is home to about 20% and India about 17% of the world's population.

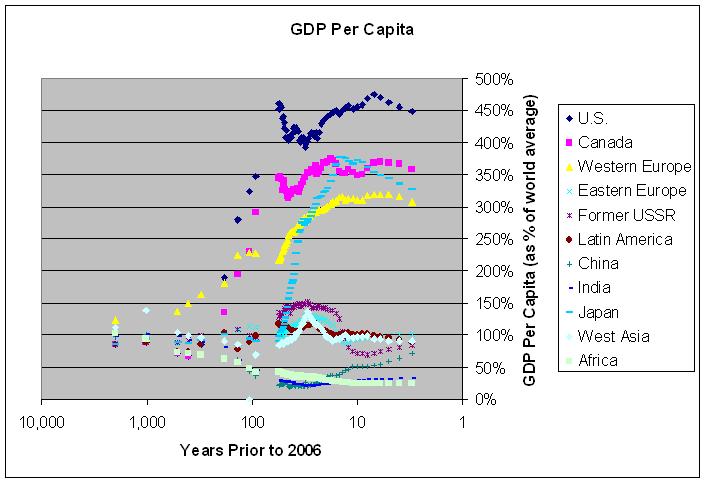
For examining trends in economic growth, more revealing than either GDP or population alone is what we obtain by putting the two together--GDP per capita. The graph to the right clearly exhibits the "economic divide" that has developed between countries of the world during the most recent 150 years. Driven by technological advancements, the U.S. and Canada, the consortium of Western European nations (particularly Britain, Germany, France and Italy) and, more recently, Japan (along with South Korea, Singapore, Hong Kong and Taiwan) have sprinted ahead of the remainder of the world in terms of GDP per capita. The U.S.S.R.'s economic strength temporarily rose above the global mean in the Cold War years (late 1950s through 1980s) but fell precipitously in the late 1980s with the collapse of Soviet Communism. During the most recent decade, the former U.S.S.R. (Russia) and Eastern Europe have been recording significant gains in GDP per capita, along with China and India.

Implications for Investors

What, then, is in store for the world in the upcoming century?

  • First of all, on the basis of its large population (1.3 billion people) and rapid economic growth (9% to 10% per annum), it is almost a certainty (i.e., barring political disruption, social unrest or a large-scale war) that China's economy will become the world's largest in terms of GDP (again, on a purchasing power parity (PPP) basis) over the next decade or so.

  • With its population projected to surpass China's around 2030, India's GDP will also rise, so that China and India will likely again jointly dominate the world's GDP like they did up until about 150 years ago when technological advancement permitted "the West" to surge ahead.

  • Assuming current growth trends continue, we should also expect Russia and Eastern Europe, along with a host of countries in Asia and Latin America, to cross the "economic divide," joining the U.S., Canada, Western European nations and Japan. With the diffusion of technology, the result will hopefully be a bridging of the economic divide, with a more equal "spread" of country-to-country GDP per capita, somewhat akin to the world's tighter per-capita wealth distribution two millennia ago.


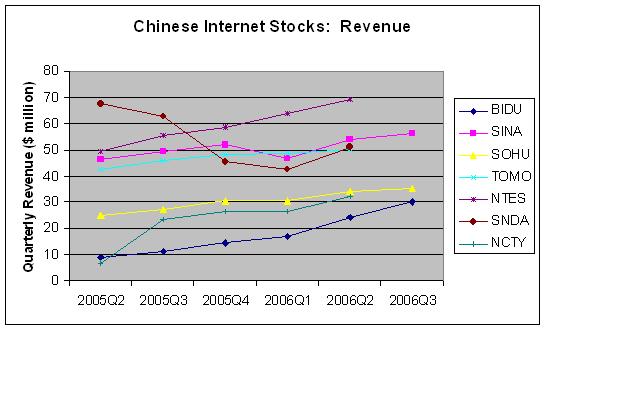
  • The clear message for investors today is to "go global" in order to profit from international growth trends, overweighting the emerging economies on the verge of crossing the economic divide. In particular, China is the obvious place to increase one's exposure, as investors have been discovering with the near doubling of the Shanghai Composite over the past year (galloping from 1074 in December 2005, to 2054 today). For investors who want to ride the general equity market higher but do not have the time or desire to analyze individual stocks, the iShares FTSE/Xinhua China 25 ETF (ticker: FXI) is a good choice. This ETF tracks a portfolio consisting of 25 large cap, Hong Kong-listed stocks of Chinese companies. Many of these 25 companies also have U.S.-listed (on NYSE or Nasdaq) ADRs, for anyone who prefers (like I do) individual stocks over funds. Among the well-known Chinese ADRs readily accessible to U.S. investors are: state-run oil company, PetroChina (PTR), with a massive market cap of $220 billion (Warren Buffet presciently bought 1.3% of PetroChina three years ago); telecom and mobile service providers, China Telecom (CHA), China Mobile (CHL) and China Unicom (CHU); and life insurer, China Life (LFC), whose share price has tripled in secondary market trading following its IPO a year ago. Other Chinese companies worthy of consideration include the younger Internet companies with more volatile share prices, that I have written about earlier (see here and here). And we can expect still more companies doing business in China--such as the economy hotel operator, Home Inns (HMIN), which issued its IPO in October--to bring their IPOs over the months and years ahead.

    For an indication of how attractive returns can be through piggy-backing on rapid GDP growth, consider the advantage of investing in Japan during the 1950-1980 post-war rebuilding period: During these three decades, America's S&P 500 rose seven-fold from 20 to 136, for an annualized return of 6.5%; while, on the other side of the Pacific, the Japanese Nikkei 225 stock index zoomed ahead 70-fold from 102 to 7,116, producing a much richer annualized return of 15.2% (data from Global Financial Data). Taking into account currency moves, from 360 yen per dollar in 1950 to 204 yen per dollar in 1980 (data available at Wikipedia), the U.S. dollar-based return for American investors becomes an amazing 123-fold over 30 years, or 17.4% annualized. Similarly, looking ahead over the next two or three decades, I believe it very likely that China's GDP growth in the 9% to 10% per annum range will drive higher stock market returns than are available through America's comparatively low GDP growth of 3% per annum. With the strengthening of the Chinese renminbi following removal of its peg to the U.S. dollar in 2005, we can also expect that changes in the RMB-U.S. dollar currency rate will boost returns, as was the case for the Japanese yen during Japan's post-war period of rapid economic growth.

    Finally, a cautionary note on timing: While historical trends over the past couple of decades are a bullish indicator on China's long-term economic growth prospects and stock market performance, I also feel that near-term investor sentiment may be a little overheated. I believe that tucking a few shares away into one's portfolio at current market prices for the long haul is a smart move, but would wait for a 15% to 20% pull-back like the one we saw in May-June before backing up the truck and greedily increasing exposure further.

    Bottom line: Load up on equities in countries like China with significantly higher expected GDP growth rates than the U.S. offers. While U.S. equity market averages may yield seven-fold returns over the next 30 years, history shows that countries with substantially higher GDP growth rates can easily deliver much sweeter 100-fold and higher returns over the same time period.

    Sunday, November 19, 2006

    "Pair Trade" Idea: It's Time to Go Long Yahoo Japan and Short Yahoo U.S.

    [Figure caption: The slide to the left shows integration of Yahoo content on PCs and mobile phones in Japan. Expect launch of Softbank Mobile phones with a dedicated Yahoo button to drive new traffic and revenue opportunities. Source: Softbank's (ticker: SFTBK.PK, company number: 9984 on TSE) earnings presentation for the quarter ending Sep. 30, 2006.]

    If I were a long-short, "market neutral" hedge fund manager*, I would go long Yahoo Japan (listed on Tokyo Stock Exchange, company number: 4689) and short Yahoo U.S. (Nasdaq-listed, ticker: YHOO) at the market open Monday morning. Here's why this trade now looks attractive:

    Yahoo Japan's Steadier Fundamentals But Sharper Share Price Decline

    Over the past couple of years, Yahoo U.S. and Yahoo Japan have both been growing revenues at about 25% year-on-year. As the graph shows, Yahoo Japan's growth has been steady, while Yahoo U.S. was hurt in 2006Q3 by a slowdown in ad spending but expects to report a stronger 4th quarter. Note that the financials of both companies exhibit some seasonality, with calendar year-end Q4 stronger than other quarters.

    Net income shows a similar pattern: Yahoo Japan has achieved persistent quarterly growth, while Yahoo U.S.'s earnings have been more erratic, rising rapidly in 2005 but softening this year. Consensus estimates (EPS $0.13 per share for Q4, up from $0.11 in Q3), however, suggest that some earnings "catch up" may be in the cards.

    The deterioration of Yahoo U.S.'s stock price (Friday's close of $26.91 was 38% off its 52-week high of $43.66 in January) reflects challenges the company has been facing both externally (Google (GOOG) continues to whittle away at Yahoo U.S.'s paid-search market share) and internally (tell-tale sign: this weekend's leak of "The Peanut Butter Manifesto" describing the company's lack of focus and coordination and ineffective top-down leadership). Interestingly, over the same time period, the fall in Yahoo Japan's stock price has been even more pronounced (Friday's close of 40,200 yen was 55% off its 52-week high of about 90,000 yen, also from back in January).

    Observing the sharp decline in Yahoo Japan's share price, one might presume that its local market competitive positioning and future prospects are worse than they are for Yahoo U.S. However, such is hardly the case. Although Google has been making recent progress in Japan with the Google toolbar as a traffic driver, Yahoo Japan continues to enjoy impressive mindshare among Japanese Internet users. According to a recent NetRatings report, the ranking among Japanese Internet properties in September was:

    Unique Audience:
    #1: Yahoo Japan, 38.5 million
    #2: Rakuten, 25.7 million
    #10: Google Japan, 17.4 million

    Page Views:
    #1: Yahoo Japan, 23.6 billion
    #2: Rakuten, 4.3 billion
    #3: Google Japan, 2.0 billion

    Observe that Google lags Yahoo in Japan by a very wide margin. Over the past year, Google has risen in the rankings but still sits clear back in the #10 spot based on unique audience, and attracts just 8% of the number of page views Yahoo receives.

    Backed by Masayoshi Son's Softbank (which owns 41% of Yahoo Japan), Yahoo Japan got off to a very early start in Japan in 1996 and has maintained its dominant position as leading portal and online auction site (eBay withdrew from Japan in 2002, after failing to gain significant market share from Yahoo Japan). Yahoo Japan's broadband initiative, Yahoo BB, has become Japan's largest ADSL Internet service provider since launch in 2001, overtaking incumbent fixed-line provider NTT through price competition and innovative "triple play" (ADSL Internet access, VOIP phone, and Internet-based broadband TV) services. Furthermore, Softbank's new role as a mobile phone operator (through purchase earlier this year of Vodafone's Japan unit) should lead to new revenue opportunities for Yahoo Japan from monetization of Internet traffic coming from mobile phone users. In my opinion, Yahoo Japan stands to gain by providing integrated cross-platform (PC and mobile phone) data services that other players in the Japanese market will have a hard time matching.

    Playing the Cross-Border "P/E Inversion"

    Following its year-to-date price decline, just how cheap has Yahoo Japan become? A look at current P/E ratios (using annualized quarterly earnings) tells the story. During 2005, Yahoo Japan's P/E was 80 to 100, compared to Yahoo U.S.'s P/E in the lower range of 60 to 70 (adjusted to account for Yahoo U.S.'s 33.4% ownership of Yahoo Japan). This relationship--with the Japan P/E higher than the corresponding U.S. P/E--is as expected, since Japanese interest rates (the 10-year Japanese government bond yields 1.7%) are lower than U.S. interest rates (the 10-year Treasury yields 4.6%), and Japanese stocks generally trade at higher average P/E ratios than U.S. stocks. During the course of this calendar year, as a result of its rising earnings but falling stock price, Yahoo Japan's P/E has collapsed from above 100 in January, all the way down to 42 as of last Friday's close.

    The bar chart to the right displays the recent "inversion" of the normal U.S.-Japan P/E relationship in Yahoo's shares. Expressed in P/E-equivalent terms, U.S. bonds, as expected, trade "cheaper" (1/0.046 = 22) than their Japanese counterpart (1/0.017 = 56). Similarly, a recent comparison of global P/E ratios shows the average U.S. stock market P/E of 18 to be substantially lower than the average Japanese stock market P/E of 37--again as expected. On the other hand, the Yahoo Japan vs. Yahoo U.S. P/E relationship has become inverted: Based on Friday's close of $26.91 and the consensus EPS estimate of $0.13 for 2006Q4, Yahoo U.S. has a current P/E of 26.91/(4 x 0.13) = 52, which reduces to 43 after adjustment for Yahoo U.S.'s equity ownership in Yahoo Japan. Quite unexpectedly, then, Yahoo Japan's P/E of 42 is now anomalously lower than the P/E of Yahoo U.S.

    Given the core fundamentals--with Yahoo Japan's business on a sounder footing that its parent's in the U.S.--I believe that the comparatively large "discount" the market has priced into Yahoo Japan's shares is unjustified. Part of the cheapness in Yahoo Japan's share price could be coming indirectly from the unimpressive subscriber growth numbers at Softbank Mobile during the initial few weeks of mobile phone number portability (as of October 24, Japanese users can switch mobile operators but keep the same phone number). However, we are still in the very early days of the launch of Softbank Mobile and, if the earlier success of Yahoo BB is any indication, we should expect to see substantial growth of Softbank Mobile's subscriber numbers in the years ahead, catalyzed by new pricing plans, enhanced cell tower coverage, integrated services, and the widest selection of cell phones available in the market. I see an inherent synergistic relationship between Yahoo Japan's enormous user base and Softbank Mobile's services that should over the next few years allow 1) Softbank Mobile (currently with 16% market share) to win market share from DoCoMo (56%) and KDDI (28%), and 2) Yahoo Japan to strengthen its dominant position as Japan's top Internet content and services provider.

    The current Yahoo U.S. versus Yahoo Japan "P/E inversion" is unlikely to persist for long (expect a reversion to the norm, analogous to how inverted yield curves tend to revert back to having positive slopes). In my view, given the current, peculiar, cross-border P/E inversion in Yahoo's shares, going long Yahoo Japan and short Yahoo U.S. is a timely pair trade with substantially greater upside potential than downside risk.

    (* I'm do not manage a hedge fund. However, I recently sold shares of Yahoo U.S. and bought shares of Yahoo Japan, to express the same differential view by "embedding" the pair trade described in this article into my long-only portfolio.)

    Thursday, November 16, 2006

    Survey of Internet Growth: What's Hot and What's Not

    Gazing into the crystal ball. . . (Image credit)

    Beyond the phenomenal growth in user traffic at popular websites MySpace and YouTube, where else is Internet growth the hottest?

    The most widely available source of data for tracking website growth is Alexa. Compared to a listing of the world's top 15 websites almost two years ago as ranked by Alexa, today's ranking shows:

  • Status Quo: 10 of the top 15 websites remain on the list: yahoo.com, msn.com, google.com, baidu.com, qq.com, sina.com.cn, yahoo.co.jp, ebay.com, 163.com, sohu.com;

  • Newcomers: New to the list are: myspace.com, live.com, youtube.com, orkut.com, wikipedia.org;

  • Departures: Websites that have dropped out of the top 15 are: passport.net, microsoft.com, 3721.com, daum.net, amazon.com.


  • Video sharing (YouTube), social networking (MySpace and Orkut), collaborative editing (Wikipedia) and Microsoft's new Live search project are hot, but let's drill deeper down Alexa's ranking list for confirmation of trends.

    Where the Internet Crowds Are Going

    By categorizing each of the top 100 websites by type (e.g., Google is for search, Yahoo is a portal, Amazon and eBay are commerce-oriented, etc.) and ranking each by its growth in "reach" (defined as percentage of all Internet users who use the particular website, based on data from Alexa) over the past two years (November 2004 through November 2006), we can see what types of websites are growing in popularity and which are not. Here's the result, showing how fast various categories have extended their reach (fastest growing categories higher up on list), with representative examples of the fastest growing websites in each category:

    1. Media Sharing: youtube.com, flickr.com
    2. Search: google.com, baidu.com, google.com.br, live.com
    3. Blog: blogger.com
    4. Utility: megaupload.com, rapidshare.de
    5. Social Networking: myspace.com, orkut.com
    6. Informational: wikipedia.org, digg.com
    7. Software: sourceforge.net
    8. Portal: qq.com, yahoo.com.cn
    9. Commerce: craigslist.com

    Category Trends: The above list illustrates the increasing importance of Web 2.0 as a platform for user-generated content (video clips on YouTube, photos on Flickr, blogs on Blogger, re-mixing of music and other media content on MySpace, collaborative wiki-style editing on Wikipedia, user-selected news on Digg). Even the fastest growing websites in the more traditional portal and commerce categories are built on user-participation (e.g., instant messaging on QQ, and for-sale and help-wanted ads on Craigslist), indicating just how pervasive Web 2.0 content has become. The power of search also derives from user-generated content, since blogs, photos, wiki articles and other content generated by all of us out in the "long tail" of the distribution feed the search engine bots crawling the web 24 hours a day.

    We can also group the websites geographically to see which regions of the world have the fastest growth. In order of growth in reach (with faster growth higher up the list), the ranking by geographical region, with examples of high growth websites in each category, is:

    1. South America/Mexico: google.com.br, google.com.mx
    2. Eastern Europe/Russia: google.pl, yandex.ru
    3. India: google.co.in
    4. U.S./Canada: google.com, youtube.com, wikipedia.org, blogger.com, myspace.com, orkut.com
    5. Western Europe: rapidshare.de, google.co.uk, google.de
    6. Middle East: google.com.sa
    7. Asia: qq.com, baidu.com, yahoo.com.cn

    Geographical Trends: The regions with the fastest overall growth are South America (especially Brazil, Chile and Argentina), Mexico, Eastern Europe (Poland) and Russia. The U.S. is home to many of the fastest growing websites, such as YouTube, Wikipedia, Blogger and MySpace; however, older U.S. websites, such as Yahoo, MSN, eBay, AOL, have actually shrunk in terms of percentage reach over the past couple of years, creating a "middle of the road" performance for U.S. websites as a whole. Asia has its share of rapidly growing websites, such as Baidu and Tencent's QQ; however, there are also many older websites, such as Sina and Sohu in China and Naver and Daum in Korea whose reach has contracted noticeably. Another trend evident from the list is that the fastest growing websites in many of the regions are localized Google properties, such as Google Brazil, Google Poland, Google India, Google U.K. and Google in Arabic for the Middle East.

    Extrapolating Recent Trends

    We can use the Alexa data to obtain a rough sense for what the online world might look like a couple of years from now. The chart to the right shows a list of today's top websites by reach. Yahoo, Google and MSN occupy the top three slots, all showing over 25% reach. These dominant websites are followed by a combination of Chinese (Baidu, QQ, Sina, 163 (Netease), Sohu) and U.S. (YouTube, Wikipedia, Microsoft, Blogger, MySpace, etc.) websites, each with reach in the 3% to 9% range.

    The next chart shows the websites with the highest growth in reach over the past two years. Leading the list is Google, whose reach leaped ahead more than 10 percentage points (from 17% in 2004 to 27.5% today). Among the U.S.-based websites, YouTube, Wikipedia, Blogger, MySpace and Orkut all showed increases in reach of three to six percentage points. The Chinese sites QQ and Baidu extended their reach by an additional four percentage points. Two recently launched sites that have grown very rapidly are Yahoo China (sold by Yahoo last year to Alibaba; Yahoo in turn holds a 40% equity stake in Alibaba) and Microsoft's Live (part of Ray Ozzie's plan to revamp and reposition the company's web properties).

    We can make a very crude estimation of what the distribution of website reach could look like in two years' time by simply extrapolating past growth trends into the future:

    (Future Reach Two Years From Now)
    = (Current Reach) + (Prior 2-Year Change in Reach)

    Obviously, as has always been true of the Internet, there will undoubtedly be new websites that surface and rise to popularity over the upcoming two years. However, the linear extrapolation at least gives us a very rough feel for how current momentum will impact Internet growth. The "linear" scenario indicates a world increasingly dominated by Google, though Yahoo and MSN remain important portals. Fast-growing YouTube, Baidu, Wikipedia and QQ rise beyond 10% reach, with Blogger, MySpace and Orkut close behind.

    Implications for Stock Investors

  • The future is a Google world (as least for now). Google controls not just search; it also owns some of the fastest growing web properties: YouTube, Blogger and Orcut. Internationally, Google is clearly the dominant search provider (Google Canada, U.K., Germany, France, Spain, Italy, Poland, Brazil, Mexico, Chile, Argentina, Japan and India all rank in the top 100 websites), though notable exceptions are in China (with Baidu) and Russia (with Yandex) where local players have larger market share. With paid search-related advertising being a business that scales well to capture previously untapped demand from so many small- and medium-sized businesses in the "long tail" of the distribution, Google unquestionably occupies a "sweet spot" of growth. At trailing and forward P/E ratios of 63 and 36, respectively, Google's shares might not seem cheap; however, buying Google (GOOG) on any significant price dips is a worthy strategy to consider. I believe that a forward PEG of less than one, currently corresponding to a stock price of $13.70 x 32.5 = $445, would be an attractive entry point. That's a 10% discount from Google's $496 closing price today.

  • China is the growth story of the 21st century but certain websites are clearly growing much faster than others. Dominant Chinese search provider Baidu (BIDU) (see prior post) and Tencent's QQ portal (shares listed in Hong Kong) are interesting ways to participate in triple-digit annual growth.

  • Yahoo (YHOO) (owner of rapidly growing photo-sharing site Flickr; also participating in the rapid growth of Yahoo China through its equity interest in Alibaba) and Microsoft (MSFT) (with Live search) offer ways to tap into growth but appear at this juncture to be more traditional web and software investments than high-growth "pure" plays. However, if Yahoo and Microsoft should succeed in capturing search market share back from Google, expect to see good upside in their stock prices as well.

  • Unfortunately for investors interested in high-growth "pure" plays, so many of the hottest new web properties are either absorbed by larger players (e.g., Yahoo bought Flickr, Rupert Murdoch's News Corp. bought MySpace, Google bought YouTube) or non-profit (Wikipedia).


  • These web traffic trends echo the ongoing transformation taking place in both how we use the Internet and who uses the Internet. Driven by active participation from a younger demographic, we are seeing spontaneous, user-generated content replace more formal, "newspaper-style," company-provided content. As the YouTubes, Googles, MySpaces, Bloggers and Wikipedias of the world steal eyeballs from the older portals and commerce sites, the "business model" of the Internet continues to shift further towards advertising. Interestingly, at least in general, business-model terms, advertising becomes as central as it is in the traditional "free" (i.e., no charge to viewer or listener) TV and radio industry. However, this time around, ad spending (supply side) is coming from small, local businesses, as well as the traditional, large corporate advertiser; likewise, instead of being limited to just 10 or 20 channels, we now potentially have as many channels as there are participants (demand side).

    So, where's the Internet taking us? To use a programming analogy attributed to Tim Berners-Lee (see discussion here), if stage one (Web 1.0) was about reading available information at portals sites and elsewhere on the Internet, and stage two (Web 2.0) is now about writing and contributing our own content to the mix, it does appear useful to think of the next stage (Web 3.0) as an execution layer, i.e., fertile ground for the so-called "semantic web" with programs capable of at least rudimentary natural language understanding--a partial realization of the "smart" machines that artificial intelligence has promised for decades. . . . Clearly, we are not there yet but, as the history of technology has repeatedly shown, the opportunities for entrepreneurs and investors will only get better.

    Saturday, November 04, 2006

    Chinese Internet Stocks: Barbelling for High Returns with NetEase at the Low-PE End

    "Barbelling": A stock investment strategy involving concurrent long positions in both low-P/E and high-P/E stocks, premised on the assumption that the market tends to undervalue the growth potential of the "outliers" at both extremes of the price-earnings spectrum. (Photo credit)

    With Sohu (SOHU), Baidu (BIDU) and Sina (SINA) having reported earnings during the past couple of weeks, we are now halfway through the 2006Q3 earnings calls for leading Chinese Internet companies in the portal, search and online gaming businesses. On deck for the coming week are NetEase (NTES) after the market close on Monday, November 6; and TOM Online (TOMO) before the open and Shanda (SNDA) after the close on Thursday, November 9; to be followed by The9 Limited (NCTY) on Wednesday, November 15.

    So far for Q3, Sohu and Sina have reported solid earnings on strong growth in advertising revenues, exceeding analyst expectations and sending their share prices up 8% to 10% for the two-day periods centered about their respective earnings releases. Baidu's Q3 earnings and revenues exceeded expectations but revenue guidance was lighter than expected (attributed by management to a two-quarter transitional period needed for Baidu's advertisers to grow accustomed to recent changes introduced to optimize the company's ad monetization algorithm), resulting in highly volatile trading though little net price movement between the run-up to actual earnings release and Friday's close.

    The Bigger Picture: Revenue and Earnings Fundamentals

    It's easy to get carried away by all of the hype and emotion of short-term trading opportunities resulting from large price swings around earnings release dates. However, if we step back from the day-to-day volatility, we can obtain a clearer view of which stocks are most likely to perform best over a longer holding period.

    The revenue graph to the right reveals the varying "signatures" of the three types of Internet companies we are dealing with:

  • Search (Fastest Growth): Baidu shows the smallest but fastest growing revenue. Paid search revenue has been growing at the enviable clip of 20% to 40% per quarter, easily four- or five-fold the growth rate of typical "growth stock" companies;

  • Portal (Fast Growth): Quarter-on-quarter revenue growth at Sina, Sohu and TOM averages around 5% to 10%, driven primarily by consistent growth in brand advertising. The recent dropoff in wireless value-added services revenue due to policy changes at China Mobile (soon to be mirrored by China Unicom) has impacted total revenue;

  • Gaming (Volatile Growth): NetEase, with about an 85/15 split of gaming versus portal (i.e., advertising and wireless value-added services) revenue, has enjoyed remarkably steady revenue growth over the past year on the strength of its two popular massively multiplayer online game (MMOG) titles, Westward Journey Online II and Fantasy Westward Journey. Shanda's revenue displays the volatility more typical of the gaming industry as game titles rise and fall in popularity. The9's recent hit, World of Warcraft (currently the number one MMOG in China), has created a noticeable uplift in the company's revenue over the past year.


  • Net profit margins also reveal differences in the character of the businesses:

  • Search: Baidu's net profit margins have risen and now sit around the 30% level (similar to Google's);

  • Portal: Sina, Sohu and TOM typically run at 15% to 25% net profit margins;

  • Gaming: Because NetEase develops its own games in-house, its margins are the highest of the group, hovering at a very robust 55% to 60%. Shanda's volatile margins reflect a shift the company made to a "free to play" business model and its push into the new area of home entertainment (which could provide more steady growth prospects). The9 follows a licensing model, offering lower margins than those available through in-house game development.


  • Overall, fundamentals indicate higher predictability of revenue streams and profitability in the search and portal businesses than in online gaming. However, since investors try to avoid uncertainty by gravitating towards industries with more top- and bottom-line financial regularity, good companies in volatile industries are often available at a discount.

    Where's the Sweet Spot in the P/E Spectrum?

    Using analyst consensus EPS figures for calendar year 2007 and 5-year earnings growth estimates (available on Yahoo Finance), we can plot forward P/E ratios against estimated earnings growth based on Friday's closing prices for the stocks we are considering. Viewing the data plotted in this way, we can see that the lowest PEG ratios (forward P/E divided by 5-year estimated growth) correspond to the Chinese Internet stocks with the lowest and highest P/E ratios:

  • Low P/E: The9 has a forward P/E of 12.5 (= 23.50/1.88), estimated growth rate of 25%, and a PEG of just 0.50. Similarly, NetEase has a forward P/E of 13.0 (= 16.13/1.24), growth rate of 21%, and PEG of 0.62;

  • High P/E: Interestingly, the next lowest PEG is Baidu's at 0.74, at the high end of the P/E and growth spectrum, based on a forward P/E of 51 (= 86.87/1.70) and estimated growth rate of 69%.


  • In other words, assuming that Wall Street's consensus estimates are the "best reasonable guess" at future performance of each of the companies, the stocks with the lowest PEG ratios (i.e., best value) in today's market happen to sit at opposite ends of the P/E spectrum.

    We can proceed to run a scenario analysis to see how an investment in each of the stocks would perform over the next five years, assuming that we buy at Friday's closing price, that earnings for 2007 meet analyst estimates, and that earnings grow thereafter in accordance with the 5-year consensus growth estimates. The graph to the right shows the annualized investment return resulting from a range of terminal P/E ratios at the end of the 5-year investment horizon. Notice that, for like P/E ratios, the stocks with the lowest PEG ratios--The9, NetEase and Baidu--offer the most attractive pro forma returns. If P/E ratios five years from now end up in a modest range around 20, the low PEG stocks will deliver 30% annual returns (vs. just 10% returns for their higher PEG brethren). If P/E ratios five years from now are higher, say, around 30 (which is very possible and perhaps even too conservative for Baidu), annual returns could approach the very attractive 40% level.

    Current market pricing of Chinese Internet stocks, then, suggests a "barbell" strategy involving taking long positions in both low-P/E (The9 and NetEase) and high-P/E (Baidu) stocks. Personally, I prefer NetEase over The9 because NetEase has a portal business to help cushion its fall if its gaming revenues soften, whereas The9 is dependent solely on gaming revenue. NetEase also has a longer operating history with more significant revenue and profitability than The9 (The9's annual revenue did not rise above the $5 million mark until 2005, propelled by the success of World of Warcraft). From a risk-return point of view, I like Baidu (see prior blog article) at the high-P/E end of the barbell, but for diversification I have recently taken a smaller position in NetEase at the low-P/E end.

    Prospects for NetEase

    Come Monday, we will see if NetEase beats analyst estimates ($0.28 EPS on $72 million revenue) to extend the winning streak for Chinse Internet stock 2006Q3 reporting led off by Sohu, Baidu and Sina. Portal advertising revenue will likely be strong, as it was for Sohu and Sina; however, even moderate weakness in gaming revenue beyond what's already priced into analyst estimates could very easily send NetEase shares into a tailspin. It is also possible that continuing lack of interest among Chinese gamers in NetEase's 2.5D game (Datang) and/or any delays or cautionary remarks regarding the company's upcoming and highly anticipated first-tier 3D game (Tianxia II, with open beta testing slated to begin by the end of Q4) could lead to a more muted outlook for 2007. Any new analyst downgrades on top of the already lengthy string of recent downgrades, any reduction of the EPS estimate for 2007 (now at $1.24, which is 10% above the $1.13 estimate for 2006), or a moderation of longer term growth estimates would negatively impact the share price. And, looking ahead, what if existing game revenue actually starts ramping down before new game revenue ramps up? Or, worse yet, what if Tianxia II turns out to be a complete flop?

    But we can also paint a rosier picture: Suppose that NetEase is able to maintain revenue and earnings growth by continuing to publish expansion packs for Wesward Journey Online II and Fantasy Westward Journey until Tianxia II revenue firmly kicks in. The company's solid revenue track record provides evidence that its in-house game development team understands as well as, if not better than, any of its competitors how to tailor MMOGs for the Chinese market, and its success could very well continue, even with a game pipeline relying on only one or two primary titles. Then, aside from gaming, there's the possibility of revving up monetization of all of NetEase's portal traffic, which according to Alexa is higher than Sohu's (and Sohu manages to garner $35 million in quarterly revenue from brand advertising, wireless VAS and paid search, versus just $11 million for NetEase). NetEase also has the greatest number of free email users in China; hence, there ought to be an opportunity for monetization here as well.

    So, maybe the consensus estimate of $1.24 EPS on $328 million in revenue (17% above estimated 2006 revenue) in 2007 is achievable. Maybe this time Wall Street analysts have their numbers right. Maybe NetEase will at least meet or perhaps even beat estimates for 2006Q3 with its earnings release on Monday. Maybe the company's $100 million share repurchase program (announced at end of August 2006, and ongoing for up to six months) will help its depressed shares join the party (versus one year ago, share performance has been: Sohu, up 50%; Sina, up 13%; NetEase, down 23%). And maybe 35-year old founder and CEO, William Ding, will muster up the resolve (in his own words: "Smart guys seize opportunities. . .") to grow NetEase's business and boost himself back into the #1 spot in China's wealth ranking, a position he briefly held three years ago when NetEase shares reached a prior peak (trading around $17 in October 2003, roughly where the stock trades today). Since 2003, other more fortunate Chinese (see the new Forbes list) have seen their wealth rise--while Mr. Ding's net worth has stalled, easing him down (pun not necessarily intended) to the #12 position among China's richest today.

    Lots of maybes here. Maybe too many? Hopefully not, though time will tell. Let's see what Mr. Ding and company deliver after the closing bell on Monday.