"Pair Trade" Idea: It's Time to Go Long Yahoo Japan and Short Yahoo U.S.
 [Figure caption: The slide to the left shows integration of Yahoo content on PCs and mobile phones in Japan. Expect launch of Softbank Mobile phones with a dedicated Yahoo button to drive new traffic and revenue opportunities. Source: Softbank's (ticker: SFTBK.PK, company number: 9984 on TSE) earnings presentation for the quarter ending Sep. 30, 2006.]
If I were a long-short, "market neutral" hedge fund manager*, I would go long Yahoo Japan (listed on Tokyo Stock Exchange, company number: 4689) and short Yahoo U.S. (Nasdaq-listed, ticker: YHOO) at the market open Monday morning. Here's why this trade now looks attractive:
Yahoo Japan's Steadier Fundamentals But Sharper Share Price Decline
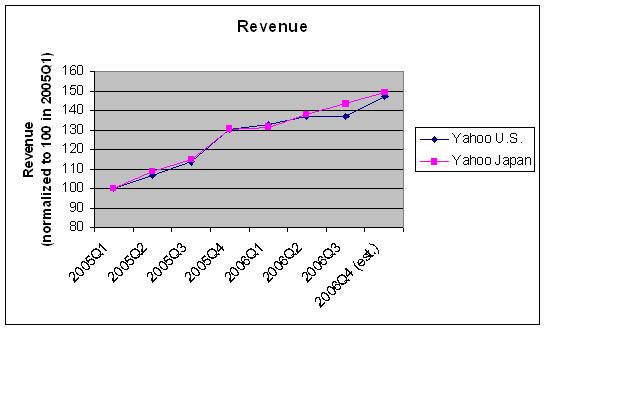 Over the past couple of years, Yahoo U.S. and Yahoo Japan have both been growing revenues at about 25% year-on-year. As the graph shows, Yahoo Japan's growth has been steady, while Yahoo U.S. was hurt in 2006Q3 by a slowdown in ad spending but expects to report a stronger 4th quarter. Note that the financials of both companies exhibit some seasonality, with calendar year-end Q4 stronger than other quarters.
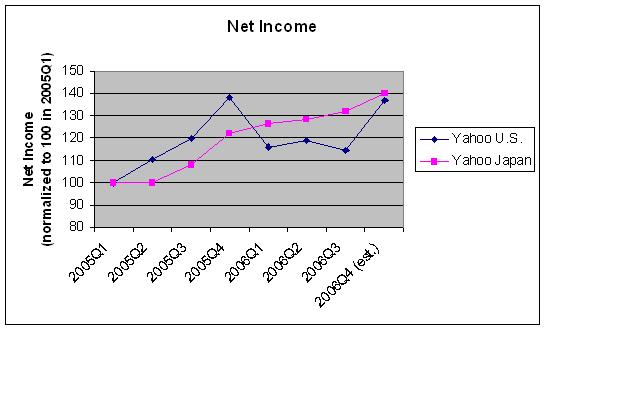 Net income shows a similar pattern: Yahoo Japan has achieved persistent quarterly growth, while Yahoo U.S.'s earnings have been more erratic, rising rapidly in 2005 but softening this year. Consensus estimates (EPS $0.13 per share for Q4, up from $0.11 in Q3), however, suggest that some earnings "catch up" may be in the cards.
 The deterioration of Yahoo U.S.'s stock price (Friday's close of $26.91 was 38% off its 52-week high of $43.66 in January) reflects challenges the company has been facing both externally (Google (GOOG) continues to whittle away at Yahoo U.S.'s paid-search market share) and internally (tell-tale sign: this weekend's leak of "The Peanut Butter Manifesto" describing the company's lack of focus and coordination and ineffective top-down leadership). Interestingly, over the same time period, the fall in Yahoo Japan's stock price has been even more pronounced (Friday's close of 40,200 yen was 55% off its 52-week high of about 90,000 yen, also from back in January).
Observing the sharp decline in Yahoo Japan's share price, one might presume that its local market competitive positioning and future prospects are worse than they are for Yahoo U.S. However, such is hardly the case. Although Google has been making recent progress in Japan with the Google toolbar as a traffic driver, Yahoo Japan continues to enjoy impressive mindshare among Japanese Internet users. According to a recent NetRatings report, the ranking among Japanese Internet properties in September was:
Unique Audience:
#1: Yahoo Japan, 38.5 million
#2: Rakuten, 25.7 million
#10: Google Japan, 17.4 million
Page Views:
#1: Yahoo Japan, 23.6 billion
#2: Rakuten, 4.3 billion
#3: Google Japan, 2.0 billion
Observe that Google lags Yahoo in Japan by a very wide margin. Over the past year, Google has risen in the rankings but still sits clear back in the #10 spot based on unique audience, and attracts just 8% of the number of page views Yahoo receives.
Backed by Masayoshi Son's Softbank (which owns 41% of Yahoo Japan), Yahoo Japan got off to a very early start in Japan in 1996 and has maintained its dominant position as leading portal and online auction site (eBay withdrew from Japan in 2002, after failing to gain significant market share from Yahoo Japan). Yahoo Japan's broadband initiative, Yahoo BB, has become Japan's largest ADSL Internet service provider since launch in 2001, overtaking incumbent fixed-line provider NTT through price competition and innovative "triple play" (ADSL Internet access, VOIP phone, and Internet-based broadband TV) services. Furthermore, Softbank's new role as a mobile phone operator (through purchase earlier this year of Vodafone's Japan unit) should lead to new revenue opportunities for Yahoo Japan from monetization of Internet traffic coming from mobile phone users. In my opinion, Yahoo Japan stands to gain by providing integrated cross-platform (PC and mobile phone) data services that other players in the Japanese market will have a hard time matching.
Playing the Cross-Border "P/E Inversion"
Following its year-to-date price decline, just how cheap has Yahoo Japan become? A look at current P/E ratios (using annualized quarterly earnings) tells the story.
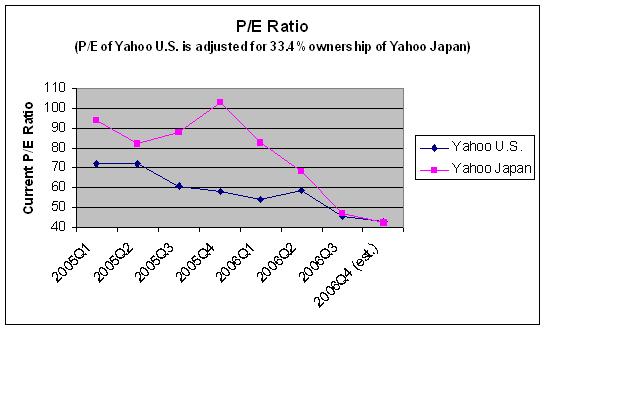 During 2005, Yahoo Japan's P/E was 80 to 100, compared to Yahoo U.S.'s P/E in the lower range of 60 to 70 (adjusted to account for Yahoo U.S.'s 33.4% ownership of Yahoo Japan). This relationship--with the Japan P/E higher than the corresponding U.S. P/E--is as expected, since Japanese interest rates (the 10-year Japanese government bond yields 1.7%) are lower than U.S. interest rates (the 10-year Treasury yields 4.6%), and Japanese stocks generally trade at higher average P/E ratios than U.S. stocks. During the course of this calendar year, as a result of its rising earnings but falling stock price, Yahoo Japan's P/E has collapsed from above 100 in January, all the way down to 42 as of last Friday's close.
 The bar chart to the right displays the recent "inversion" of the normal U.S.-Japan P/E relationship in Yahoo's shares. Expressed in P/E-equivalent terms, U.S. bonds, as expected, trade "cheaper" (1/0.046 = 22) than their Japanese counterpart (1/0.017 = 56). Similarly, a recent comparison of global P/E ratios shows the average U.S. stock market P/E of 18 to be substantially lower than the average Japanese stock market P/E of 37--again as expected. On the other hand, the Yahoo Japan vs. Yahoo U.S. P/E relationship has become inverted: Based on Friday's close of $26.91 and the consensus EPS estimate of $0.13 for 2006Q4, Yahoo U.S. has a current P/E of 26.91/(4 x 0.13) = 52, which reduces to 43 after adjustment for Yahoo U.S.'s equity ownership in Yahoo Japan. Quite unexpectedly, then, Yahoo Japan's P/E of 42 is now anomalously lower than the P/E of Yahoo U.S.
Given the core fundamentals--with Yahoo Japan's business on a sounder footing that its parent's in the U.S.--I believe that the comparatively large "discount" the market has priced into Yahoo Japan's shares is unjustified. Part of the cheapness in Yahoo Japan's share price could be coming indirectly from the unimpressive subscriber growth numbers at Softbank Mobile during the initial few weeks of mobile phone number portability (as of October 24, Japanese users can switch mobile operators but keep the same phone number). However, we are still in the very early days of the launch of Softbank Mobile and, if the earlier success of Yahoo BB is any indication, we should expect to see substantial growth of Softbank Mobile's subscriber numbers in the years ahead, catalyzed by new pricing plans, enhanced cell tower coverage, integrated services, and the widest selection of cell phones available in the market. I see an inherent synergistic relationship between Yahoo Japan's enormous user base and Softbank Mobile's services that should over the next few years allow 1) Softbank Mobile (currently with 16% market share) to win market share from DoCoMo (56%) and KDDI (28%), and 2) Yahoo Japan to strengthen its dominant position as Japan's top Internet content and services provider.
The current Yahoo U.S. versus Yahoo Japan "P/E inversion" is unlikely to persist for long (expect a reversion to the norm, analogous to how inverted yield curves tend to revert back to having positive slopes). In my view, given the current, peculiar, cross-border P/E inversion in Yahoo's shares, going long Yahoo Japan and short Yahoo U.S. is a timely pair trade with substantially greater upside potential than downside risk.
(* I'm do not manage a hedge fund. However, I recently sold shares of Yahoo U.S. and bought shares of Yahoo Japan, to express the same differential view by "embedding" the pair trade described in this article into my long-only portfolio.)
posted by Lloyd Sakazaki at 9:28 PM
![]()
![]()


9 Comments:
Great insight on the Yahoo US/Japan pair trade. Any thoughts on the GOOG short and YHOO long pair trade? I have completed a side-by-side analysis at http://etstockideas.blogspot.com and I am thinking of putting this strategy to work.
Right now, GOOG short and YHOO long is very contrarian, given GOOG's relative strength. However, the trade could be a real winner if YHOO's Panama Project is a success and YHOO can more efficiently monetize its large user base. I would wait for more definitive signs of a turnaround--stock price, traffic, strategy--before putting on the GOOG-YHOO pair trade. At the moment, I find the Alexa traffic graph (http://www.alexa.com/data/details/traffic_details?url=google.com, showing a recent crossover with GOOG overtaking YHOO) a little worrisome when contemplating a YHOO long position.
I just got a data plan on my mobile. I pretty much do not need my computer anymore since I do so much with my mobile phone. The neatest thing is that I can even watch naughty movies:) It is pretty neat, it's called Mobile TV. All I do is point my phone to sexoncell.com and they have adult mobile movies in different formats like 3gp movies, symbian, pda or whatever. If you have any other cool sites, please let me know! This one, though, even has a free daily mobile movie.
Be alerted to the Hottest Stock Picks!
Join Emerging Growth Alert Newsletter
By joining the team at Emerging Growth Alert you will be in position to receive stock alerts profiling stocks about to move or already in motion. Our alerts are sent in time for you to research, investigate and make a decision about whether this opportunity is right for you.You will not be bombarded with junk mail. There is ABSOLUTELY NO OBLIGATION, and the service is entirely FREE.
P.S.
You may think this is spam but this is only an invitation for those interested to receive Stocks alert – ONLY stock alerts... Thanks to those who subscribed :)
http://stocks.freetzi.com
http://www.zendurl.com/cashing
ART & GLOBAL WEALTH TRENDS
Today’s high net worth individual wealth is over $30 trillion and is increasing by 7% per annum. Currently, $300 billion is potentially available to be invested in art (ABN AMRO report, 2005).
http://www.artbank.ch/art.html
A 2008 study by Mamarbachi, Raya, Day, Marc and Favato, Giampiero, "Art as an Alternative Investment Asset" found that art in emerging markets [India] has produced 2000% returns over the past 8 years and by far outperformed returns of the best performing Hedge Funds like Credit Suisse Tremont Hedge Fund, Barclay Global Hedge Source Fund, or Hedge Fund Research Equal Weighed Strategies (Figure 4, page 20). New York University's Stern School of Business professors have studied art sales over 125 years and compiled it into the Mei Moses Fine Art Index. For example, a J.M.W. Turner view of Venice sold Christie's in London on May 29, 1897, for $35,000 and then sold at Christie's NY in April 2005 for $35.8 million—which yields about a 6 percent annual return for 109 years. The 1954-2004 data shows, over the last 50 years, stocks (as represented by the S&P 500) returned 10.9 percent annually, while the art index returned 10.5 percent per annum. The most recent annual five and ten year returns for art, 16.2% and 10.3%, exceed the returns of stocks often offering investors a safe heaven during stockmarket crashes. Professor Moses recently reviewed how the art market reacted to the credit crisis appearing on 179 US-PBS stations in WealthTrack series.
AUSTRALIAN ABORIGINAL ART & RETURN OPTIMISATION
More recently, art funds have been created to allow rich people to invest in a portfolio of fine art assets (e.g. a London-based Fine Art Fund, created by a former Christie's executive). Art has always followed the money, and money follows the strongest markets. Dealers like Larry “Go-Go” Gagosian, Daniella Luxembourg and Jeffrey Deitch, hedge fund moguls and newly born oligarchs want to participate in $30 Billion Private Art Sales Around the World buying multi-million dollar works. In the meanwhile, Professors Moses & Mei found (page 22, Figure 3) that art purchased for less than $100,000 produced significantly higher returns than art purchased for $100,000-$1m or higher. Professor Worthington of QUT School of Economics and Finance studied global art markets and calculated returns in Australian art market based on about 36,000 auction sales. In his study at University of Wollongong he identified Australian Fine Art as a separate Alternative Investment asset class, that produced 30-year average annual returns of 8.23% for all artists as average, in line with other world art markets, and works costing $10,000-$35,000 providing highest returns.
AUSTRALIAN ABORIGINAL ART RATE OF RETURN
Prior to 1990s Australian aboriginal art was viewed merely as part of tourism only to power charge resale values, like $1.056 million for Emily Kame Kngwarreye's Earth's Creation and $2.4m for Clifford Possum Tjapaltjarri’s Warlugulong in recent years. The Warlugulong painting was bought by Commonwealth Bank of Australia (CBA) in 1977 for $1200. In 1996, Melbourne art dealer Hank Ebes acquired the painting for $36,000 and in 2007 National Gallery of Australia acquired the painting at the Sotheby's auction for a princely sum of $2.4 million. This returned Ebes more than 6,500% on his investment, that is 600% per year (1996-2007). Never mind, if CBA would have held to their $1,200 investment, it would have returned them 200,000%,that is 6,600% per year (1977-2007). Aboriginal art works are called the outstanding paintings of the 20th century and form a $700 million industry. With recent success in Bahrain and Musee du Quai Branly in Paris aboriginal art of Australia is a rather hot investment commodity.
BEAUTY & PORTFOLIO DIVERSIFICATION
Art as an asset class was found to have less volatility and much lower correlation with other assets as found, hence a portfolio of artworks may play a somewhat more important role in portfolio diversification.
http://www.artbank.ch/advisory.html
While the idea – “don’t put all your eggs in one basket” is timeless, the funds management principles date back to the early 1950’s. In June of 1952, a 25-year-old graduate student published a provocative article in the Journal of Finance that would have a profound impact on Modern Portfolio Theory. In his writings, Markowitz discussed risk management through diversification. He found that by investing your money across a number of asset classes, there were opportunities to get more return from a given level of risk, or lower the risk of your
Bill Sharpe took Markowitz’ work and developed the Capital Asset Pricing Model (“CAPM”), and introducing Beta as a measure of market risk. Markowitz and Sharpe shared the Nobel Prize in Economic Science in 1990 for their work on Modern Portfolio Theory. Building upon the work of Markowitz and others, Gary Brinson sought to study the impact of the asset allocation policy decision. The Brinson Beebower studies, originally completed in 1986 and revisited in 1991, suggested that 93.6% of a portfolio’s change in returns over time were attributable to asset allocation policy.
www.artbank.ch
A smallish campaign with a homemade list would not be likely to yield much of a result. To achieve anything worthwhile, a much more aggressive effort is needed. Then, the age-old value analysis applies: projected earnings = margin on total projected sales - cost of campaign.
Profit n loss is a part of every business.
Ups n downs are a part of life.
If we can recognise our mistakes , face the music n keep our egos n emotion on the side we will enjoy the process. Free Commodity tips
Za rejestrację na stronie otrzymasz darmowe spiny - https://top10casinoexpert.pl/casino/yoyo-casino/
Hello everyone, Are you looking for a professional trader, cryptocurrency/forex and binary manager who will help you trade and manager your account with good and massive amount of profit in return. you can contact Mr. Bernie for your investment plan, for he helped me earned $8,600 usd with little investment of $850 usd. Mr Bernie Doran you're the best trader I can recommend for anyone who wants to invest and trade with a genuine trader, he also helps in recovery of loss funds..you can contact him on his whatsapp: +1(424)285-0682 Email:(berniedoransignals@gmail.com)I advice you shouldn't hesitate He's great.
Post a Comment
<< Home