Friday, January 27, 2006

Win-Loss Percentages, or How Having a Slight Edge Goes a Long Way

You might have heard that good traders are right only a little more than half of the time. In other words, having just a few more "up days" than "down days" can and does make all the difference when it comes to overall portfolio performance.

For an example of how daily wins and losses translate into longer-term returns, we can look at the price movement of the 30 components of the Dow Jones Industrial Average during 2005. The top performer for the year was Boeing (BA), up 41%, on a pick-up in large airplane orders as the company recoups market share taken in recent years by European competitor Airbus. The worst performer was GM (GM), down 50% for the year, on erosion of market share as American auto makers lose ground to Toyota, Honda and others. Among the 252 trading days during 2005, Boeing rose 130 days (52% of the time) and fell 122 trading days. During the same period of time, GM was up 106 days (42% of the 252 trading days) and down the remaining 146 trading days. Here we can see how winning (i.e., having an up-day) 52% of the time produces such a dramatically different result than winning a lesser 42% of the time. Just as in professional baseball, a few point spread in win-loss percentages is all it often takes to distinguish between a first place and a last place finisher.

The diagram below displays the performance of each of the 30 components of the Dow during 2005, showing how the percentage of days that a stock rises relates to its overall percentage return for the period. The data indicate a strong correlation (0.70) between winning days and overall return. The best-fit regression line has a slope of 3.8, i.e., a 1% increase in winning days (2 to 3 additional up-days during the 252-day trading year) typically leads to a 3.8% increase in return for the year.


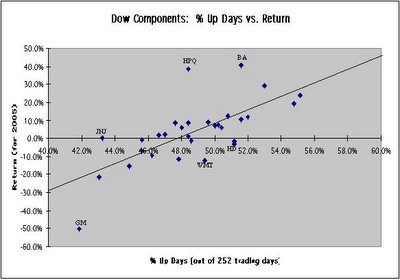
From a trading perspective, we can express this result as follows: If a trader is able to convert just one additional trading day during the year from a loss to a win, he typically boosts his annual performance by about 1.5%. Ten additional winning days (i.e., two weeks) can be expected to elevate annual performance by a full 15%. In actual market performance, the impact can even be greater--as mentioned above, a difference in outcome on just 24 trading days (130 up-days for Boeing vs. 106 up-days for GM) is all it took to create the gaping 91 percentage point chasm between the best (Boeing up 41%) and worst (GM down 50%) performers in the Dow during 2005. Clearly, having a slight edge goes a very long way in investing.

The above scatter plot also provides a "reversion to the mean" trade idea for anyone interested: I have labeled the points corresponding to the stocks showing the largest deviations from the regression line. Among these outliers, Hewlett Packard (HPQ), Boeing (BA) and Johnson & Johnson (JNJ) exhibit the greatest outperformance in return versus what would be expected based on the percentage of up-days. The greatest underperformers with respect to the regression line are GM (GM), Wal-Mart (WMT) and Home Depot (HD). Based on reversion-to-the-mean thinking--which has a plausible footing in investor over-reaction theory (i.e., investors tend to overbuy when stocks rise and oversell when stocks fall)--one might predict that the 2005 outperformers are good short candidates in 2006, while the 2005 underperformers should be considered for long positions. (Caveat: I have run some reversion-to-the-mean simulations on shorter-term trading horizons but have not managed to uncover consistently reliable excess profits. So, proceed at your own risk. More optimistically, keep in mind that only a slight edge is all that is needed to outperform the market.)

Friday, January 20, 2006

Which is the "Most Promising" Search Engine--Google, Yahoo or MSN?

Frequently cited studies by Nielsen NetRatings (usage stats: Google 46.2%, Yahoo 22.5%, MSN 12.6%, July 2005) and comScore Media Metrix (usage stats: Google 36.5%, Yahoo 30.5%, MSN 15.5%, July 2005), as conveniently summarized by SearchEngineWatch, indicate that Google owns the leading search engine, followed by Yahoo, MSN, AOL, Ask Jeeves and others. While I have no reason to question the conclusions of these studies, I generally like to run an independent check on the analysis of others. Below I summarize a simple search engine study I have conducted on Google, Yahoo and MSN, covering the primary search types offered--Web, images, news, shopping, and video.

Whereas most studies focus on usage statistics (i.e., which search engine do people use the most?), it is also interesting (and simpler) to build a quick study around plurality (i.e., which search engine returns the most hits?). The rationale for approaching the study this way is that the most comprehensive search engine (highest plurality) will also tend to have more relevant search results embedded somewhere amongst the many hits. Using sorting algorithms, engineers will over time discover more relevant and useful ways to organize and present the massive amount of information uncovered by their search bots, giving an advantage to the search engine with the widest net. Higher relevancy, in turn, leads to higher user satisfaction and greater usage. In other words, while current usage stats provide a picture of who's popular and who's not today, plurality (i.e., raw number of search results) offers a forward-looking indication of which search engine shows the most promise of becoming more popular in the future.

For lack of a better way to choose sample search queries for a plurality study, I select the top seven searches from the current "top mover" listings on both Google's Zeitgeist (for the week ending January 16) and Yahoo's Buzz (for January 19). For example, in position #5 on Zeitgeist is "Angelina Jolie pregnant," which returns 2.55 million, 3.22 million and 1.33 million hits on Google, Yahoo and MSN, respectively. For this particular search query, I assign a rating of 10.0 to Yahoo because Yahoo's Web search returns the greatest number of hits; Google receives a proportionately lower rating of 7.9 and MSN gets a rating of 4.1, based on the smaller number of hits their Web search engines return.

In addition to searching on the 14 queries cited above , I conduct Web searches on the words "Google," "Yahoo" and "MSN," again querying each of the three search engines. I display results for all 17 sample search queries in the bar chart to the right above. Observe that for this small sample, Yahoo is ahead in 11 of the 17 cases, while Google leads in the remaining six. I also remark that Google's Web search on its own name, "Google," returns 874 million hits, versus the lesser figure of 514 million hits for a Google Web search on its primary competitor's name, "Yahoo"; similarly, Yahoo's Web search returns more hits on its own name, "Yahoo" (816 million), than on its competitor's name, "Google" (499 million). Apparently, these two competing search engines have a knack for finding more occurrences of their own name, while curiously overlooking their competitor's!

(Note: My simple survey probes plurality (quantity) of hits, without addressing relevancy (quality), even though the latter is equally, if not more, important than the former. Results of studies on relevancy of search results indicate that the various search engines generate results of comparable quality: Yahoo (3.43), Google (3.37), and MSN (3.09), on a scale from 1 to 5.)

Using the 17 sample search queries, I conduct the same study on the three search engines across the five search types: Web, images, news, shopping, and video. Based on the relative rating methodology described above, I find that Google returns the most hits for images, news and shopping, while Yahoo returns the most hits for Web and video searches. MSN ends up a distant third in all search types, except for news, where it places second behind Google.

Conclusions and comments based on this brief study are:

  • Web search: Contrary to usage data showing Google ahead of Yahoo, it appears that Yahoo's Web search is able to generate in a fairly consistent way measurably more results than Google's Web search. Assuming that relevancy scales with sheer number of results, Yahoo appears to have the edge here.

  • Images search: I am somewhat surprised to find that Google comes up with more images than Yahoo, especially in light of Yahoo's historical attention to picture-ads (versus Google's focus on text-ads) and acquisition of photo-sharing site Flickr.

  • News search: Google's automated aggregation of 4,500 news sources apparently gives it an advantage here, while Yahoo historically has given priority to hand-picking of content by human editors. Yahoo's recent (still in beta) listing of news blog results alongside other news search results could possibly help to close the gap. MSN's strong showing could be related to its MSNBC news partnership with NBC.

  • Shopping search: Google's Froogle appears to have developed a clear edge over Yahoo Shopping, particularly in the area of comparison shopping.

  • Video search: Yahoo leads in this brand new search area, with Google still in early beta. Video search will become increasingly important as fast broadband connections become more widespread.


As I see it, Yahoo, which began as a content directory and is a relative late-comer in the home-grown, in-house search business, has some chance of catching up in usage stats (popularity) with Google, by leveraging its (Yahoo's, according to my survey) leading position in Web search plurality. However, at this stage in the evolution of the Web, with "search" and "Google" having become largely synonymous in the public's eye, Google is in the driver's seat. Taking a broader view, I consider both companies attractive long-term investments, based on their enviable positions at the center of the Internet universe, strong balance sheets, and tremendous growth potential. Just as Amazon and eBay's businesses have grown more similar to one another over the years, my guess is that "content king" Yahoo and "search queen" Google will find themselves treading more and more on each other's turf in the future.

I close with a comment on Google and Yahoo's stock prices. As shown in the graph to the right, following Google's IPO in August 2004, its largest percentage price drawdown peak-to-valley was 17% during last year's slump in the middle of March. At the close of this past week's sell-off, triggered by Yahoo's weak earnings report and fallout from Google's rebuffing of a Justice Department subpoena requesting search engine data, Google (GOOG, $399.46) is off 15% from its all-time high of $471.63 on January 11. Yahoo (YHOO, $33.74) has sagged even more, now sitting 22% below its recent high of $43.21 on January 6.

From a short-term perspective, both Google and Yahoo have retreated into comparatively attractive price ranges. Based on analyst estimates (from Thomson First Call), Google now trades at PE ratios of 68 (on $5.90 estimated 2005 earnings), 46 (on $8.76 estimated 2006 earnings), and 35 (on $11.44 estimated 2007 earnings). The analogous PE ratios for Yahoo are 58 (on $0.58 2005 earnings), 44 (on $0.76 estimated 2006 earnings), and 35 (on $0.96 estimated 2007 earnings). These are the lowest PE ratios yet seen for these two Internet high-fliers, though I suspect the near-term price bottom may still be somewhat lower.

(Disclosure: I own shares of Yahoo. I continue to look for an attractive opportunity to buy Google and will reconsider following the company's 2005Q4 earnings announcement on January 31.)

Thursday, January 19, 2006

Where to Invest When the Housing Market Cools

Single-family homes have been a highly profitable place to invest for the past few years, with median U.S. house prices appreciating at a rapid double-digit clip not seen since the late 1970s. Like all bull markets, however, this trend will sooner or later reverse itself. Given indications that the housing market may be cooling as we move into 2006, it makes sense to consider alternative places to invest those extra dollars you have lying around.

We all know that stock prices are more volatile than real estate prices. The graph to the right shows stock index and house price appreciation data for the past 30 years (source: Yahoo for stock indices, OFHEO for house prices). Stock prices tend to bounce around quite a bit, while real estate prices move in a slower, more predictable fashion.

From an asset allocation perspective, what is of interest is the degree of correlation between stocks and real estate. As might be expected, the S&P 500 and Nasdaq stock indices have a high positive correlation of 0.80. When one goes up, so does the other. Similarly, the two stock indices tend to fall in tandem.

Real estate prices, on the other hand, have historically shown little relationship to stock prices, as indicated by the tremendous degree of "scatter" in the diagram to the right. The correlation of the S&P 500 stock index to U.S. median house prices is, in fact, slightly negative (-0.18), based on data from the past 30 years.

What's the implication? My interpretation is that, as the housing market cools, the stock market will likely become an increasingly attractive place to invest, consistent with the slight negative correlation between the two asset classes. 2005 was a year in which house prices (12% year-on-year increase in U.S. median house prices for period ending the third quarter of 2005) outperformed the stock market (3% return for the S&P 500). I expect that during 2006, it will be the stock market's turn to play a little catching up, as investors shift some of their speculative capital from rentals and second homes into stocks and mutual funds.

Saturday, January 14, 2006

Anticipating Yahoo's 2005Q4 Earnings Announcement

True to the company's usual celerity in announcing quarterly earnings, Yahoo (YHOO) kicks off the year-end 2005 reporting season this coming Tuesday, January 17, after market close. Analysts are expecting $0.17 earnings for the fourth quarter of 2005 on $1.07 billion revenue excluding traffic acquisition costs (TAC). This revenue number is 36% above the figure reported a year ago and at the upper end of the company's guidance of $1.032-$1.082 billion given last October.

With 2005 now behind us, market reaction to Yahoo's earnings report will largely hinge on the company's guidance for 2006. Analysts are projecting revenues excluding TAC of $1.09 billion for 2006Q1 (33% above 2005Q1) and $4.77 billion for the year (29% above the projected 2005 figure). Because the quarterly earnings releases and conference calls provide the most in-depth view into the financial health of a company's business, the quarterly earnings announcements often trigger high price volatility, as the market responds to the news. Over the past few reporting periods, the single-day price movement of Yahoo's stock directly following reported earnings and guidance has been varied--down as much as 11% (following 2005Q2 earnings announced in July, 2005), and up as much as 16% (following 2004Q1 earnings announced in April, 2004).

On earnings announcement day, the million dollar question is: will the company report and guide higher or lower than expectations? Based on long-term fundamentals, I have held shares of Yahoo for most of the past decade (view: Yahoo, with their unparalleled site stickiness and community feel, built on broad content offerings, strong relationships with content providers and user involvement in content creation, is best positioned among Internet leaders to benefit from increased global online usage over the years ahead). Though I tend to invest for the long term, I am also interested in examining shorter-term stock behavior to see if any trading insight that can be gleaned for positioning purposes just prior to earnings announcements.

In an attempt to identity any patterns in price movement occurring around the earnings announcement dates, I have analyzed data from 2002 through 2005. By aligning all of the earnings announcement dates (defined as Day 0) for the 16 quarterly reporting periods, I make the following observations about short-term price and volume movement:

1. With high regularity, volume increases dramatically on the trading day following the earnings announcement. Volume is also elevated during the trading session just prior to the announcement, as traders adjust their positions in anticipation of the upcoming earnings release.

2. Unlike volume, however, the stock price does not move in such an obviously predictable way. Although price volatility noticeably rises, the direction of price movement exhibits little, if any, regularity. Note the volatile "spray" of stock price movement following Day 0 in the chart to the right. The stock price sometimes moves higher and other times moves lower in reaction to earnings news.

To gauge any cause-and-effect embedded in the short-term price and volume data, I have examined the relationship between price or volume changes just prior to the earnings announcement and the resulting price movement following the announcement:

3. For the 16 quarterly reporting dates during the past four years, there is no simple relationship between price movement prior to announcement and price movement immediately following announcement. In other words, pre-announcment price information does not appear to provide insight into the direction of post-announcement price action.

4. Likewise, pre-announcement volume does not appear to be a reliable indicator of the direction of post-announcement price movement. However, as shown in the figure to the right, one relationship that seems to hold is that higher pre-announcement trading volume leads to higher post-announcement price volatility--note the larger oval to the right in the diagram.

So, as might have been expected, we have the familiar (see Are Big Price Moves Predictable? (I) and An Example of Typical Price Behavior (II)) conclusion that:

Past (volume in this case) volatility begets future (volume and price) volatility. On the other hand (much to our chagrin), the past offers little, if any, useful information regarding the direction of future price movement.

What, then, can we say about how Yahoo ($39.90 at close on Friday, January 13) will trade following the 2005Q4 earnings announcement this coming Tuesday? While unable to make a directional prediction with any confidence, I offer the following:

Watch pre-announcement trading volume of Yahoo during the day on Tuesday. If more than about 45 million shares trade during the day (i.e., more than double the prior two-week average of 22 million shares, expect a large gap up or down (could exceed 10%) in price after the close when earnings are announced. On the other hand, if daily trading volume on Tuesday is less than aboout 35 million shares, expect more muted price action following the announcement.

The data seem to indicate that the market is somewhat successful in anticipating large surprises--either blow-out earnings or a significant earnings miss, which lead to a large gap up or gap down, respectively, in price following the earnings announcement. Unfortunately, the essential piece of information required to profit from trading the market--i.e., direction of price movement--remains as completely hidden within the foggy haze of numbers as ever.

Monday, January 09, 2006

2005 Winners and Losers and a Stockpicking Clue for 2006

In stock investing, we all wish we had the foresight consistently to pick winners and avoid losers. According to Moneycentral's list for 2005, the top 20 performing stocks sported impressive returns ranging from 273% to 1217%, while the bottom 20 performers saw equally remarkable value destruction to the tune of 70% to 79%.


Clearly, investors who owned NutriSystem (NTRI) or Hansen Natural (HANS) during 2005 made out like a bandit, while anyone unfortunate enough to hold Travelzoo (TZOO) or Movie Gallery (MOVI) must wish they hadn't.

The million dollar question, of course, is: How do we pick winners and avoid losers? A first step to picking winners is understanding what distinguishes a winning stock from a losing one. Using data provided by Moneycentral, we can look at quarterly earnings and revenue growth for each of the top 20 and bottom 20 performing stocks from 2005. By focussing on the median earnings and revenue growth figures in each group, we arrive at results in line with expectations:

1. A typical stock in the best performing group shows accelerating earnings growth moving from 2004 into 2005, while, on the other hand, the worst performers exhibit sharply deteriorating earnings.


2. The best performers show steadily growing revenues from 2004 continuing into 2005, while the worst performers exhibit shrinking to negative revenue growth.


On the whole, the market responds rationally to earnings and revenue changes. Stocks with increasing revenues and accelerating earnings are bid up by investors, while those with deteriorating financial performance are shunned.

While this simple analysis is not a crystal ball for picking the winners in 2006, it does provide a clue as to where one might begin to look for excess returns. Referring again to the earnings graph, note that for a typical stock in the top-20 group, earnings are slightly negative to only slightly positive during the first three quarters of 2004. Then, in the fourth quarter of 2004, earnings suddenly zoom higher. This trend of accelerating earnings continues into 2005. Driven by accelerating earnings, stock prices of companies in this top-20 group rose spectacularly throughout 2005 to give multi-bagger returns for the year.

Though much easier said than done, here's a prescription for finding multi-baggers in 2006: Look for companies with growing revenues whose reported earnings are "on the cusp," having recently transitioned from negative to positive and with potential for explosive growth as revenues expand further. Risk can be managed by following a portfolio approach, i.e., buying a handful of these "on the cusp" stocks rather than placing all bets on one company.

Saturday, January 07, 2006

New Year Opening Rally Is a Bullish Sign

Anecdotal evidence suggests that the first week of trading in the new year provides a hint of what's to come over the balance of the year. In my own investing, I rely more on fundamentals than technicals, but with this past week's strong rally (S&P 500 up 3.0%, DJIA up 2.3%, and Nasdaq up 4.5%) ushering in the new year, I couldn't resist the temptation to spend a few hours over the weekend examining pure price behavior. Question: Is a rally during the first week of trading in January a bullish sign for market performance over the remainder of the year?

Using daily price data for the S&P500 going back to 1950, I have extracted returns during the first four trading days of each calendar year and paired these off with returns transpiring over the remainder of each year. The graph below shows a scatter-plot of the relationship between opening-week (defined as the first four trading days) and remainder-of-year (following the first four trading days) returns:


As is often the case with cause-and-effect relationships in the financial markets, there is a lot of shotgun-like "scatter" in the data, making it difficult to discern any clear-cut pattern. Upon closer inspection, however, I believe it is possible to glean a pattern embedded in the data. By ordering the four-day return data from low to high and dividing the 55 data points (one for each of the years between 1951 and 2005, inclusive) into five equal groups (quintiles), we can rearrange the data in the scatter-plot diagram to arrive at the quintile chart below:


With the data represented in this way, note the positive correlation between opening-week and remainder-of-the year returns:

  • Average remainder-of-year returns are highest when opening-week returns are highest. For quintile 5, with opening-week returns in the range from 2.25% to 6.0% (cf., this year's opening-week return of 3.0%), remainder-of-year returns have averaged 14%. On the other hand, when opening-week returns have been negative (quintiles 1 and 2), remainder-of-year returns have averaged a much lower 4% to 7%;
  • When opening-week returns have been above 2%, remainder-of-year returns have been positive (i.e., greater than zero) 83% of the time. On the other hand, negative opening-week returns have been followed by positive remainder-of-year returns a significantly lower percentage (55%) of the time.

With the first week of trading this calendar year (2006) having exhibited an historically strong performance (only eight of the 55 years between 1951 and 2005 have seen S&P 500 returns exceeding 3.0% over the first four trading days), the balance of the trading year should be up as well--assuming the past offers some guidance on what we might expect in the future.