What 2000 Years of History Tells Us About China's Economic Future
 Photo credit
For a day-trader, a few weeks can seem like an eternity. For a speculator, a few months is an extended holding period. For an investor, a few years is considered long-term. For making a fortune, a few decades (plus perseverence, timely decision-making and good luck) are typically required. For us Americans, a few centuries is what we mean by "history." However, if we want to understand our own economic future, we really should look back much further in time--a couple of millennia, in fact--to develop the proper perspective.
Two Thousand Years of Economic History
Angus Maddison is a pioneeering macro economist who has devoted his academic career to studying the history of global economic growth. Adopting a quantitative framework, he has assembled GDP numbers that help us understand the impact of technology on civilization, going as far back as the historical record permits.
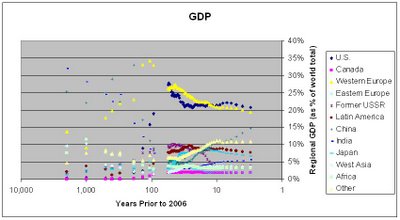
Based on the results of Professor Maddison's research, incorporating purchasing power parity (PPP) adjustments, the graph to the right shows how the contributions of various countries and regions to world GDP have shifted over the past two thousand years:
1 A.D.: In the first year of the Gregorian calendar, China and India represented the economic center of the world, together commanding 57% of the world's GDP. At this time, with the Roman Empire approaching its prime, Western Europe accounted for a lesser 14% of the world's GDP. By contrast, the American continents remained as yet largely "undiscovered," deserving little more than a footnote in the annals of world economic history;
1500-1700 A.D.: A full millennium and a half later, the post-Renaissance period with its Age of Enlightenment vaulted Western Europe to new cultural and economic heights, allowing Europe's GDP to catch up to China and India's;
1820-1900 A.D.: The Second Industrial Revolution of the 19th century carried Western Europe's GDP even higher, and also catalyzed the rapid rise of the U.S. as an important economic power.
1950 A.D.-present: Western Europe and its "offshoot" (Maddison's terminology) U.S. economy represented about 54% of the world's GDP in 1950, but this combined percentage has fallen over the past few decades to about 40% where it sits today. Following on the coattails of Japan's economic growth spurt in the post-World War II years between 1950 and 1990, China (and India, though at a more moderate pace) has begun to rise again. Through accelerated growth, China's economy has gone from representing just 4% to 5% of the world's GDP in the decades (1949-1976) of Chairman Mao's rule to more than 15% today.
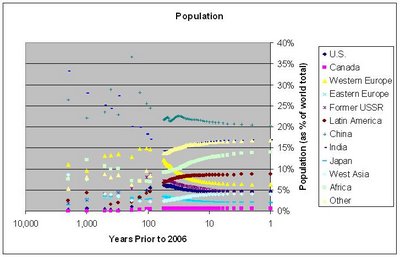 Of course, much of reason for China and India's dominant share of world GDP a millennium or two ago was the sheer size of their headcount (acknowledging, too, that favorable economic conditions allow populations to grow). Up until the mid-1800s, China and India each represented between 20% and 35% of the world's population; in other words, the majority of the people in the world lived in either China or India. As the populations of Africa, Latin America and certain other regions of the world have grown at faster rates over the past century, today China is home to about 20% and India about 17% of the world's population.
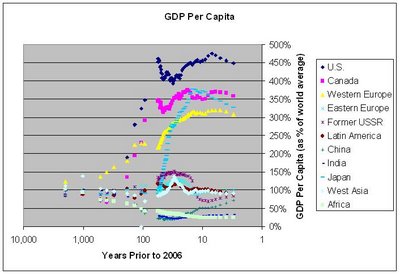 For examining trends in economic growth, more revealing than either GDP or population alone is what we obtain by putting the two together--GDP per capita. The graph to the right clearly exhibits the "economic divide" that has developed between countries of the world during the most recent 150 years. Driven by technological advancements, the U.S. and Canada, the consortium of Western European nations (particularly Britain, Germany, France and Italy) and, more recently, Japan (along with South Korea, Singapore, Hong Kong and Taiwan) have sprinted ahead of the remainder of the world in terms of GDP per capita. The U.S.S.R.'s economic strength temporarily rose above the global mean in the Cold War years (late 1950s through 1980s) but fell precipitously in the late 1980s with the collapse of Soviet Communism. During the most recent decade, the former U.S.S.R. (Russia) and Eastern Europe have been recording significant gains in GDP per capita, along with China and India.
Implications for Investors
What, then, is in store for the world in the upcoming century?
The clear message for investors today is to "go global" in order to profit from international growth trends, overweighting the emerging economies on the verge of crossing the economic divide. In particular, China is the obvious place to increase one's exposure, as investors have been discovering with the near doubling of the Shanghai Composite over the past year (galloping from 1074 in December 2005, to 2054 today). For investors who want to ride the general equity market higher but do not have the time or desire to analyze individual stocks, the iShares FTSE/Xinhua China 25 ETF (ticker: FXI) is a good choice. This ETF tracks a portfolio consisting of 25 large cap, Hong Kong-listed stocks of Chinese companies. Many of these 25 companies also have U.S.-listed (on NYSE or Nasdaq) ADRs, for anyone who prefers (like I do) individual stocks over funds. Among the well-known Chinese ADRs readily accessible to U.S. investors are: state-run oil company, PetroChina (PTR), with a massive market cap of $220 billion (Warren Buffet presciently bought 1.3% of PetroChina three years ago); telecom and mobile service providers, China Telecom (CHA), China Mobile (CHL) and China Unicom (CHU); and life insurer, China Life (LFC), whose share price has tripled in secondary market trading following its IPO a year ago. Other Chinese companies worthy of consideration include the younger Internet companies with more volatile share prices, that I have written about earlier (see here and here). And we can expect still more companies doing business in China--such as the economy hotel operator, Home Inns (HMIN), which issued its IPO in October--to bring their IPOs over the months and years ahead.
For an indication of how attractive returns can be through piggy-backing on rapid GDP growth, consider the advantage of investing in Japan during the 1950-1980 post-war rebuilding period: During these three decades, America's S&P 500 rose seven-fold from 20 to 136, for an annualized return of 6.5%; while, on the other side of the Pacific, the Japanese Nikkei 225 stock index zoomed ahead 70-fold from 102 to 7,116, producing a much richer annualized return of 15.2% (data from Global Financial Data). Taking into account currency moves, from 360 yen per dollar in 1950 to 204 yen per dollar in 1980 (data available at Wikipedia), the U.S. dollar-based return for American investors becomes an amazing 123-fold over 30 years, or 17.4% annualized. Similarly, looking ahead over the next two or three decades, I believe it very likely that China's GDP growth in the 9% to 10% per annum range will drive higher stock market returns than are available through America's comparatively low GDP growth of 3% per annum. With the strengthening of the Chinese renminbi following removal of its peg to the U.S. dollar in 2005, we can also expect that changes in the RMB-U.S. dollar currency rate will boost returns, as was the case for the Japanese yen during Japan's post-war period of rapid economic growth.
Finally, a cautionary note on timing: While historical trends over the past couple of decades are a bullish indicator on China's long-term economic growth prospects and stock market performance, I also feel that near-term investor sentiment may be a little overheated. I believe that tucking a few shares away into one's portfolio at current market prices for the long haul is a smart move, but would wait for a 15% to 20% pull-back like the one we saw in May-June before backing up the truck and greedily increasing exposure further.
Bottom line: Load up on equities in countries like China with significantly higher expected GDP growth rates than the U.S. offers. While U.S. equity market averages may yield seven-fold returns over the next 30 years, history shows that countries with substantially higher GDP growth rates can easily deliver much sweeter 100-fold and higher returns over the same time period.


