Shopping for Kid-Friendly Growth: "Hey, Dad. Where's the Next McDonald's?"
 How should a 10-year old kid invest $500? After spending the past year in CDs at our local WAMU earning 4% interest (in case you are wondering, we exercised the bump-up options), my kids are gearing up to make their first stock investments. We are planning to open up custodial accounts at Sharebuilder, since the company has no minimum balance requirement and offers attractive, rock-bottom commissions of just $4 per trade.
On its Website, Sharebuilder provides a list of the most popular 50 stocks that its customers buy. Among the household names that every kid has heard of are:
Retailers: Wal-Mart (WMT), Home Depot (HD), Starbucks (SBUX), Target (TGT), Lowe’s (LOW), Costco (COST), McDonald’s (MCD), Whole Foods (WFMI), Krispy Kreme (KKD);
Tech/Internet Companies: Microsoft (MSFT), Google (GOOG), Apple (AAPL), eBay (EBAY), Dell (DELL), Yahoo (YHOO);
Others: Disney (DIS), Ford (F), Coca-Cola (KO), PepsiCo (PEP), General Motors (GM), Boeing (BA).
I have offered various comments on soft drink makers, doughnuts, and some of the Internet and tech companies in prior posts. Today I turn to the retailing sector, where we find many of the most successful growth stocks of all time.
A Retrospective Look at McDonald’s
The textbook example of the chain-store growth phenomenon is McDonald’s, which (according to the company’s Website) got its start in 1954 when 52-year old Ray Kroc mortgaged his house and tapped his entire lifetime savings to become the exclusive distributor for a five-spindled milk shake mixer. Eight of these milk shake mixers soon found their way into an innovative Southern California fast-food hamburger stand run by two brothers named Dick and Mac McDonald. Mr. Kroc’s enthusiasm and persistence convinced the McDonald brothers put him in charge of franchising the fast-food Speedee Service System they had developed a few years earlier and were using at eight locations. In 1955, Mr, Kroc set up in Des Plaines, Illinois, the restaurant that McDonald’s counts as its first franchise. Today, after a half-century of impressive growth as leader of the fast-food industry, McDonald’s operates, either directly or through franchisees, over 32,000 restaurants in 119 countries.
Anyone prescient enough to have put aside a few dollars of hamburger money for buying McDonald’s stock early on should be financially very content today. I recall visiting my local McDonald’s to fill up their 18-cent burgers during the 1960s while growing up in Southern California. Today these basic hamburgers run $1 apiece on McDonald’s value menu. Let’s compare this five- or six-fold rise in hamburger price to an investment in McDonald’s stock over the same four decades. An hypothetical $500 invested in 20 shares of McDonald’s stock in 1965 (the year of its IPO) would have become 1458 shares through 12 stock splits, and today would be worth (assuming reinvestment of dividends) more than 1000 times (!) the initial investment. That’s a compound annual growth rate (CAGR) of 19% over 41 years, miles ahead of the single-digit returns (e.g., S&P 500 at 6.7%) for the overall market. In dollar terms, $500 invested in the S&P 500 in 1965 would be worth $7,200 today. This 15-fold appreciation is a decent return-on-investment, but it’s a far cry from the $520,000 that the McDonald’s investment would have generated.
Growth Waves
McDonald’s success marks the beginning of the rapid growth of multiple waves of chain-store retailers over the past 50 years:
 1950s-1960s: McDonald’s grows through franchising the Ronald McDonald and Golden Arches theme to serve millions and millions of hamburgers daily. Burger King (founded in the 1950s, IPO expected later this year), Wendy’s (WEN, founded in the 1960s) and Dairy Queen (owned by Berkshire Hathaway, founded in the 1940s) are a few of the other successful chains in the fast-food business.
 1970s-1980s: Home Depot takes the big-box retailing concept into a huge specialty area, do-it-yourself home improvement, quickly becoming the second largest retailer by sales (behind only Wal-Mart). Competitor Lowe’s (founded in the 1940s) got an earlier start but grew more slowly. A few of the other prominent specialty retailers are Best Buy (BBY, consumer electronics), Office Depot (ODP, office supplies) and Michaels (MIK, arts and crafts) .
 1980s-1990s: Starbucks carves out a new marketing niche, espresso coffee bars in a hip urban setting, showing how ambience and décor can add dollars of retail value to a cup of coffee costing just pennies wholesale. Look-alikes, even in China, have a hard time competing with the mystique and pervasive brand appeal of this Seattle-based purveyor of hot beverages brewed from a roasted blend of the Arabica coffee bean.
 1990s-2000s: Whole Foods (founded in 1980, IPO in 1992) rides a new consumer wave in the high quality, organic and health foods area. Wild Oats (OATS, 112 stores) and Trader Joe’s (private, more than 200 stores, with a “best price” mantra) operate in a similar grocery niche.
To illustrate how successful retailers expand revenues and profits over many decades, let’s track the growth of McDonald’s (MCD), Wal-Mart (WMT), Home Depot (HD), Starbucks (SBUX) and Whole Foods (WFMI) using common metrics: number of stores, sales, net income, profit margins, earnings per share and company stock price. The consistent growth exhibited by successful retailers makes them good candidates for a long-term stock investment portfolio.
 The graph (on a logarithmic scale to display all companies on the same chart) to the right shows the how these five retailers have persistently--each and every year without fail--increased the number of stores they operate either directly or through franchisees. Even McDonald’s, the oldest (51 years since its founding) and most prevalent (32,000 restaurants under operation) among them, is adding another 800 new locations (2.5% of existing store count) during 2006. Starbucks is growing at the fastest clip, with plans to add 1,800 new cafes (16% of its existing store count of 11,000) this year.
 For successful retailers, sales rise measurably faster than store count, driven by new products being added to the line-up, lower prices that draw customers away from smaller mom-and-pop retailers, and natural increases in population that give rise to new customers. Growth slows over time as retailers expand; however, this retailer “aging” process takes decades, indicating that the younger operators like Starbucks and Whole Foods most likely have at least another decade of strong double-digit growth still to come. To meet customer demand, Whole Foods has been opening increasingly larger stores (new store pipeline averages 55,000 SF per location), leading to annual sales growth above 20%, even though the growth rate in store count is around half this figure.
 Net income is noticeably more variable than sales, since profits are affected by less predictable changes in operating expenses and occasional one-time charges. Nevertheless, over the span of a few years, the trend in profit margins (net income/sales) tends to be remarkably steady. Most likely due to Wal-Mart’s corporate policy of passing along savings to the customer, its profit margin has been steadiest of all, averaging 3.5% with a standard deviation of just 0.4% for the years from 1968 to 2005. Home Depot’s and Starbucks’ profit margins are perhaps the most robust of all, since they have actually been rising steadily over the years, to 6.8% for Home Depot and 7.8% for Starbucks in fiscal year 2005.
 Of course, over time what drives stock prices is growth in the bottom line, i.e., diluted earnings per share. The graph to the right shows EPS growth for the five retailers. Notice the gradual slowdown as companies mature. McDonald’s, being the oldest operator in the bunch, sits lowest in the graph, with some volatility around 2002 corresponding to competitive pressures from other fast-food restaurants, the Mad Cow Disease scare and other external factors. Successive “geologic” layering in the direction of higher EPS growth takes us up through Wal-Mart, next Home Depot and finally to Starbucks and Whole Foods, both of which expect to grow earnings at better than 20% annually over the next few years.
 In a completely rational world, year-to-year stock returns should track EPS growth with similar volatility. However, as evident from the graph to the right, stock returns are strikingly more volatile than EPS growth. Apparently, investors’ emotions are the culprit behind this disparity between year-to-year EPS growth and stock returns. When Starbucks reported fiscal year 2006Q1 earnings earlier this month, beating consensus estimates by 2 cents a share, the stock jumped 10% the next day to an all-time high. Similarly, when Whole Foods missed consensus earnings by a penny a week or two ago, its stock dove 9%. A slew of macroeconomic worries (inflation fears, energy prices, GDP growth, the trade imbalance, exchange rates, rising interest rates, etc.) also contributes to general market volatility, which impacts the stock prices of even companies with the most consistent earnings. While price volatility may be nerve-wracking at times for unprepared investors, it actually is a positive factor when viewed in a more constructive way: Irrational selling of shares of successful companies that consistently report strong earnings growth can provide alert investors with attractive opportunities to buy growth on the cheap.
Investment Timing
How, then, do we tap into the steady growth of successful retailing businesses to achieve predictable investment profits for our own pocketbooks? First of all, given the volatility of the stock market as a whole and, even more to the point, individual stocks within it, taking a long-term outlook when investing one’s money is vital for success. One could, of course, just plunge in and buy any of these well-known companies today and hold for at least five or ten years, with the likely outcome being a respectable positive return, based on the companies’ track records of delivering consistent growth. I believe, however, that with a more deliberate approach it should be possible to do significantly better, or at least to enhance one’s chances of performing much better.
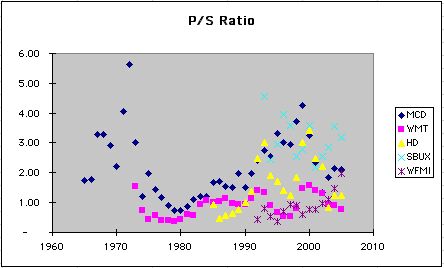 The graphs to the right and below show the price-to-sales (P/S) and price-to-earnings (P/E) ratios of our five selected retailers over their entire post-IPO trading histories. I would not go so far as to claim that I am able to discern predictable P/S and P/E cycles in the data; however, there definitely have been times when these ratios were relatively high or relatively low compared to, say, the immediately prior 10 or 15 years. For example, the trough around 1980, when ratios were low, indicates a good time to have bought into McDonald’s and Wal-Mart. It is also interesting to observe that this buying opportunity presented itself a full decade or longer after the companies’ IPOs in 1965 and 1970, respectively.
 Similarly, a great time to buy into Home Depot was in the mid- to late-1980s, about 5 to 10 years after the company’s 1981 IPO, by which time the stock had cheapened relative to sales and earnings. For a lengthy period that followed, from 1985 to 2000, Home Depot’s stock delivered impressive 40% annualized returns, driven by both a) the continuing strength of the company’s sales and earnings growth, and b) seemingly endless expansion of P/S and P/E multiples culminating in the “irrational exuberance” of the late 1990s.
 Taking a five-year horizon (which is the minimum investment term I typically consider), we can plot P/S and P/E ratios against stock returns over the subsequent five years in an attempt to identify a cause-and-effect relationship. The scatter plots to the right and below clearly indicate how investing when P/S and P/E ratios are low has historically led to better returns. Observe that each company tends to have its own idiosyncratic “trading band,” generally sloping down from left to right. Better value has typically come from buying when P/S and P/E are low (left, upper end of the band), giving rise to higher returns over the subsequent five years, compared to investing in periods when the ratios are higher (right, lower end of the band).
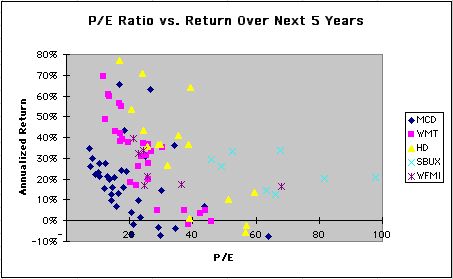 Certainly there is a considerable amount of “noise” in the data, implying that it is not always the case that investing when valuation ratios are low (high) produces better (worse) returns over the ensuing five or ten years. In my opinion, however, fickle investors’ love-hate relationship with the many companies in the stock market generally assures that during any given year some stocks will be overly inflated and others overly depressed. Although investment performance enhancement through market timing is considerably more difficult than it looks, I think it remains possible to make smart guesses to achieve better-than-average investment returns, particularly when one’s investment horizon is five years or longer.
Where’s the Next McDonald’s?
Now for the $500 question: Among our five retailing contenders, which is the best investment today? Poring over the historical data, annual and quarterly reports, news releases and corporate strategic plans, I formulate my current opinion on what’s cheap and what’s not, relative to how I expect the companies to perform over the next decade. McDonald’s, Wal-Mart and Home Depot are all trading at attractive P/Es in the 16 to 18 range. However, McDonald’s new store openings and sales growth rates, at 2% and 4%, respectively, are not high enough to get me excited, since in my view this anemic top-line growth will prove to be insufficient to support sustained double-digit stock returns, even assisted by the company’s share repurchase program, some improvement in operating efficiency, rising dividends, and 88% ownership of former subsidiary and now hot publicly traded stock, Chipotle (CMG).
Starbucks, with its consistent EPS growth still hovering above 20%, focus on expanding its current 400-store portfolio in greater China, and long-term objective of building out to more than 30,000 stores, looks poised for additional growth. The company currently has a relatively low 27% of its stores located outside of the U.S., compared to 56% for McDonald’s and 37% for Wal-Mart. I like the growth prospects of Starbucks but find the stock’s trailing-12-months (ttm) P/E of 54 to present too much downside risk. Whole Foods also sports an attractive growth story, with just 181 stores currently in operation and plans for opening 72 more by the end of fiscal year 2009. One risk is the greater impact upscale retail stores like Whole Foods will inevitably feel when the economy slips into its next recession, whenever that might be. Despite Whole Foods' 17% discount from its all time high of 77 reached at the end of December, its current PE of 60 remains loftier than Starbucks’. I believe that investors who are patient enough to wait will find more attractive levels to acquire both of these high-fliers over the years ahead.
Current market pricing, then, leads me to favor the middle-aged retailers, Wal-Mart and Home Depot, both of which are expected to grow sales at an annual rate of around 10% over the next few years. Between these two companies, I prefer Home Depot, based on what I consider to be the more plausible strategic growth plan that includes expansion in the professional contractor market, do-it-for-me services and new international markets. With just 9% of its stores located outside of the U.S., and so far only in Canada and Mexico (though the company is warming up to China), Home Depot has what I consider to be a stellar international expansion opportunity. A mid-term risk for Home Depot is a possible fall-off in sales and earnings if the current housing boom driving so many home improvement projects comes to an abrupt end.

Advice to My Kids
The advice I give to my kids, as they line up at the starting blocks to make their first stock investments, is simple and straightforward:
“Buy What You Believe In”: Find a company whose future you firmly believe in, hop aboard its underlying growth train, and ride it for the long haul. Seeing how McDonald’s remains alive and well after 51 years, continuing to add new stores to its chain, albeit at a slower pace than before, it is very likely that the other four companies we have considered above have decades of solid growth ahead. However easy it may sound to make money investing, please keep in mind there have also been and will continue to be many retailers (think of K-Mart and, more recently, the Gap and Radio Shack) whose sales have faltered, leading investors to question their ability to continue as viable enterprises, let alone increase store count, sales and earnings.
“Buy Right”: Investment timing is a tricky game with many pitfalls, but buying when the price is right, i.e., when prices are low relative to future growth prospects, can make a very significant difference in performance. Investing with a long-term outlook helps to “tame” the vicissitudes of the market, adds predictability of outcome and enhances one’s chances of succeeding as an investor.
With focus, perseverance and a little luck on your side, your $500 today could very well spawn a million more dollars by the time you are ready to retire. Stay awake on the road, remain optimistic, and ye shall find . . . the “next McDonald’s” just around the corner.
posted by Lloyd Sakazaki at 4:55 PM
6 comments
![]()
![]()