Sunday, October 29, 2006

Halloween Spooks: Will Baidu's 2006Q3 Earnings Trick or Treat?


(Spooked by the prospects? Photo credit)

Baidu (BIDU) reports 2006Q3 earnings after the U.S. market close on Halloween (Tuesday, October 31). Analyst consensus estimates indicate $0.26 EPS (on Yahoo Finance; other sources such as Bloomberg and MSN Money show $0.24) on $29.85 million revenue for Q3 (and $0.30 on $35.94 million looking ahead to Q4). In the Q2 earnings release in July, the company gave top line guidance of $30 million to $31 million revenue for Q3 (the company does not provide EPS guidance).

Will Baidu beat or miss, and what's the implication for the stock price?

The Competitive Landscape for Search in China

Let's first glean what we can from what has already been reported for Q3 by Baidu's competitors in the Chinese search market:

  • Google's Conference Call (October 19): "Business is very, very good here at Google, and we had an excellent quarter in all respects, especially including international. . . . Our largest European markets, the UK and Germany, performed very well, as did many other countries throughout the world, including the Netherlands, Spain, France, Italy, Canada, and Australia. While still a small percentage of our overall revenues, many of our emerging markets, most notably India and Brazil, are growing at very high rates as well." [Observation: Silent on China]

  • Yahoo's Conference Call (October 17): "[I]nternational continued to outpace the U.S., up 25% ex-TAC over the year-ago quarter . . . boosted by solid growth in both sponsored search and graphical." [Note: No specific mention of the China search market--perhaps too preoccupied up with loss of market share to Google and launch of code-name Panama search project in the U.S.?]

  • Sohu's Conference Call (October 26): "Brand advertising revenues were $21 million, representing a sequential increase of 9% and a year-on-year increase of 35%. . . . [On the other hand,] [s]ponsored search accounted for $2.9 million, representing a sequential decline of 19%, and year-on-year decline of 10%, . . . mainly due to further enhancement [of Sohu's] anti-fraudulent click mechanism, and decrease of revenues from fixed-fee paid listing. . . . We believe we are on track to more aggressively monetize Sogou when we first enhance our traffic. . . . [I]t is only when we have a really sizable webpage search from Sogou search, and also effective monetization of Sogou traffic, [that] we will start to see a gradual growth pattern similar to competitors in the U.S. [and] in China." [Upshot: Sohu's search revenue declining on weak traffic, unlike stronger competitors]


  • Google and Yahoo fail to mention search in China, presumably because the near-term impact on their multi-billion dollar revenue streams is very small, particularly with stagnant or deteriorating market share in China. If these global search market leaders were optimistic about growth prospects in China, don't you think they would be more inclined to mention the opportunity in the conference call? Local player, Sohu, goes into significant detail on search, explaining why their search revenues have declined while their non-search advertising revenues have reached record levels. They express high hopes for launch of the new 3.0 version of their Sogou search engine in 2007. In the course of Q&A, Sohu's management all but admits that, while their own search revenues are shrinking, their competitors continue to grow.

    Market research company, Analysys International, perodically releases reports addressing growth trends in China's online advertising market. During the first half of 2006, China's online advertising market grew by 19%, driven by expanding search market revenue. Brand advertising grew a moderate 3% during the first half of the year, while search-related advertising revenues (largely capatured by Baidu) leapfrogged by 72%. Search as a percentage of China's total online advertising revenue rose from 23% in 2005Q4 to 34% in 2006Q2. 
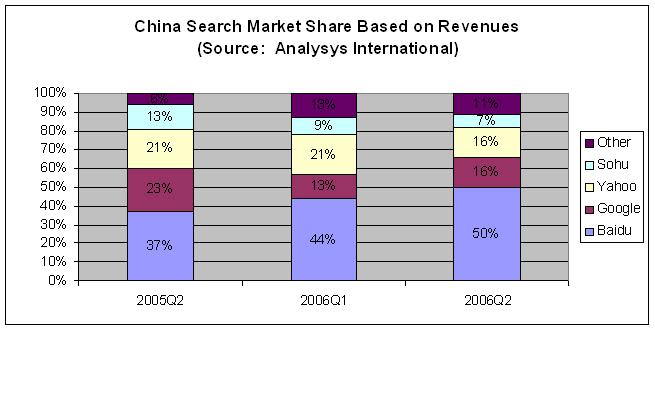
As search market revenue has risen, Baidu's share of China's search market has actually accelerated, going from 37% in 2005Q2 to 44% in 2006Q1, and expanding further to 50% in 2006Q2 (see graph). (Incidentally, back in March, Analysys forecast a "sharp slowdown in the coming 18 months" for China's search engine industry, stating that "Poor user experience, unstable advertising effects, and some irregular channel operations make the small and midsize enterprise customers of search engines suspicious of this new kind of advertising." To my knowledge, company reports to date show no sign of an imminent slowdown but, to give Analysys the benefit of the doubt, the 18-month cautionary forecast still has 11 months to run.)

    Concurrent with Baidu's growth of search market share, their active online advertiser base has more than doubled to 90,000 customers at the end of 2006Q2, up from 41,000 a year earlier. In last quarter's conference call the company mentioned that most of its 500 to 600 new hires (total company headcount reached 2,300 at the end of 2006Q2) were to be absorbed by their growing direct-marketing sales department. Apparently, management continues to see a huge opportunity to expand their online advertising customer base--no sign of any slowdown here.

    The robust momentum underlying Baidu's business appears to be a classic rendition of the network effect: more and more Chinese (particularly the younger crowd) flock to Baidu and its "sticky" search-related properties because that's where everyone else goes, more and more advertisers bid for ad keywords because that's how to reach end-customers for their products and services, and more and more affiliate websites choose to display Baidu's searchbox and toolbar because that's how to partitcipate in the fastest growing and most highly trafficked online advertising network in China.

    Anticipating Baidu's 2006Q3 Earnings Release

    With Google's global leadership (except in China) and Baidu's rising market share in China, online search is taking on the character of a "holey" (like Swiss cheese) winner-take-all business, with a competitive landscape similar to that of online auctions, where eBay apparently provides the platform in every major market except China and Japan. In the midst of Baidu's expanding search market presence, the performance of competitors in the local Chinese market tends to be counter-indicative of how Baidu's business is going (i.e., when Baidu is doing well, Google, Yahoo and Sohu are probably losing market share). Additional insight into the health of Baidu's business can come from looking beyond the local Chinese search market and examining global search market leader, Google, and the performance of its overall search business.

    Fortunately for our analysis, Google typically reports quarterly results one to three weeks prior to Baidu. Since we are concerned with predicting Baidu's earnings and the impact they will have on its stock price, we need to look at how closely market expectations match actual company performance. 
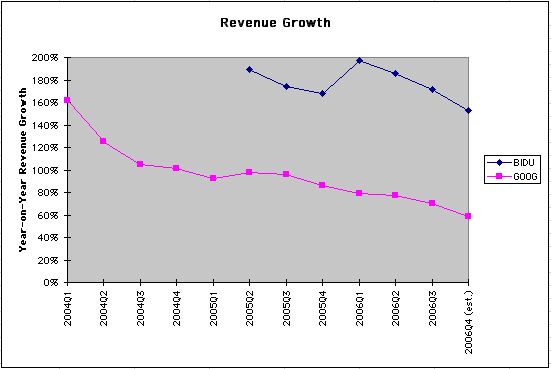
The graph to the right shows the high correlation (running at 0.65 for 2005Q3 to 2006Q2) between the outperformance of Google's and the outperformance of Baidu's reported quarterly revenues versus analyst consensus estimates. In quarters such as 2005Q3 and 2006Q1 when Google blows past consensus expectations, Baidu also tends to outperform very significantly. I believe that this high correlation can be attributed to a number of "collective" factors reaching beyond the inherent similarity of Google's and Baidu's underlying search businesses: the increasing tendency for our global economies to move in tandem, the "herd" instinct of Wall Street analysts and the investor community-at-large, the speed at which innovations (search tools in our case) in one market are soon "copied" in another, etc.

    Given the high correlation of revenue outperformance of Google and Baidu, we might also expect that stock price movement around earnings release dates of the two companies would be correlated, since earnings news drives stock prices. The graph at right shows stock returns for the 10-trading day period from one week prior to earnings release date to one week after, beginning with 2005Q2, the first quarter for which Baidu reported earnings as a public company. There is a noticeable correlation of 0.24 between Google's and Baidu's two-week stock returns around earnings release dates. For example, Google's and Baidu's shares both moved higher around their respective 2006Q1 earnings release dates in April/May, and both faltered around 2006Q2 earnings release dates in July.

    To summarize the logic:

  • When Google's reported revenue exceeds analyst consensus estimates by a large margin, Baidu's revenue also (correlation of 0.65) tends to outperform very substantially;

  • Revenue outperformance (even moreso than EPS outperformance for high-growth Internet companies) drives stock returns around earnings release dates (the correlation of revenue outperformance to stock returns is around 0.8 for Google and 0.7 for Baidu);

  • The above two factors lead to a tendency (correlation of 0.24) for Google's and Baidu's share prices to move in the same direction around earnings release dates in the same quarter, with Baidu's share price exhibiting higher volatility.


  • Conclusion: Based on similarities in the companies' underlying search business fundamentals and broader collective market effects, Google's strong Q3 earnings report ($1.87 billion reported revenues vs. $1.81 billion analyst consensus) and resulting share price appreciation (15% run-up to an intraday high of $492 on October 26, one week after the October 19 earnings release) bode well for Baidu's 2006Q3 earnings and resulting stock price performance. Google's Q3 revenue beat the consensus estimate by 3.3%. If Baidu beats by at least a similar percentage (indicating thresholds of $31 million in Q3 revenues vs. $29.85 analyst estimate, and $37 million for Q4 outlook vs. $35.94 analyst estimate), the stock should begin to lift in after-hours trading on Tuesday.

    Another benchmark for what's possible in Baidu's Q3 earnings release comes from data on the Chinese market from Nielsen/NetRatings. According to a new study, the size of China's online display advertising market (i.e., the banner ad, non-search portion) was $51 million for the month of September. Combining this with market data from Analysys (cited above), we can infer that China's total online advertising market size was about $77 million (i.e., $51 million/(1 - 0.34)), of which search contributed 34%, or $26 million. Baidu's market share would be about 50% of the search total, or $13 million for September. Applying a month-to-month growth rate consistent with Baidu's reported revenue of $16.9 million for Q1 and $24 million for Q2 to get revenue for July and August, we arrive at a Q3 revenue estimate for Baidu of about $34 million. While this figure is probably too rich (presumably caused by the unintentional vagrancies of combining two disparate data methodologies), it gives us some feel for the extent of market-leader growth that is possible in a rapidly expanding market.

    More conservatively, I note that traffic as measured by Alexa has been on the decline in China since the end of the summer for all five Chinese traffic leaders: baidu.com, qq.com (Tencent), sina.com.cn, sohu.com and 163.com (Netease). Alexa's traffic data are sharply at odds with the Nielsen/NetRatings study cited above that shows online display advertising activity (number of campaigns, advertisers and banners) growing at a very rapid clip of about 13% or 14% per month for the period from May through September, for why would more advertisers be running more campaigns displaying so many more banner ads if traffic were actually falling? My guess is that Alexa's traffic statistics, which are full of spurious-looking peaks and valleys, are highly idiosyncratic and more meaningfully employed either for comparing growth of one Web property against another or by averaging over periods of time longer than a few months.

    In language appropriate to the season, I would venture to guess that, in the wake of Google's Q3 results, anyone long Baidu (as I am) has odds of about 2/3 of being "treated" versus 1/3 of being "tricked" when Baidu releases earnings after the market close on Halloween. Recalling Baidu's "moonshot" 37% single-day rise following the company's Q1 earnings release on May 9, and shocking 21% single-day fall after the Q2 report on July 26, we should note that Baidu is an extremely volatile stock--one certainly not recommended for the faint of heart.

    Whether you happen to be long or short Baidu's shares this Halloween, could anything really be spookier than what Baidu's earnings release portends? Moonshot or cliffhanger? Fear or greed? There's thrilling suspense either way. When Tuesday's closing bell rings and the darker after-hours begin, put on your costume, grab your mask and enjoy the ride!

    Monday, October 23, 2006

    If You Missed Google's Run-Up, "Do Buy" Baidu

    Warning: The following message could be good for your financial health, but (as usual) I offer no performance guarantees.

    Pause for a moment to reflect upon what you were thinking a couple of years ago in August 2004 when Google (GOOG) went public. If you're like most people (myself included, though I have an excuse--my inaction is consistent with my stated policy of not buying IPOs), you didn't partake of the opportunity to grab a few Google shares. You sat uncomfortably sidelined when Google went public, watching with as much profit-envy as intrigue as the $85 IPO ran up to $100 on the first trading day and vaulted ahead to $200 by the end of December 2004. You rationally waited for the "inevitable" pullback to a more reasonable price level, but this pullback never materialized. Instead of buying into the fray, you passively watched Google's shares surge ahead to $300 by mid-2005 and beyond the $400 mark by year-end. Now, after a solid 2006Q3 earnings report last week, the shares sit perched at $460, close to their all-time high of $475. Following the earnings report, analysts have raised their price targets to as high as $600, reaffirming earlier optimism. At a market cap of $140 billion, a trailing P/E (2005Q4 to 2006Q3) of 58, and a forward P/E of 35 (based on analyst consensus 2007 EPS estimate of $13.07), Google is hardly cheap.

    There's also the story of Baidu (BIDU), the dominant Chinese search provider whose stock Google once owned (2.6% of Baidu's shares) but later sold. In contrast to Google's well-publicized success story (and presumably to Google's chagrin), during the past year Baidu has succeeding in further wrestling search market share away from Google in China (up to Baidu 62% vs. Google 25% in August 2006, from Baidu 52% vs. Google 33% in August 2005). With its IPO priced at just $27 in August 2005, Baidu's shares spiked to $151 before closing at $123 on the first trading day. In highly volatile trading, the shares have sagged as low as $45 in February of this year but have since recovered to close at $87 last week. Currently Baidu has a market cap of $2.9 billion, a trailing P/E of 126 (for 2005Q4 to 2006Q3, using analyst consensus EPS estimate of $0.26 for 2006Q3 earnings due out October 31), and a forward P/E of 51 (based on analyst consensus 2007 EPS estimate of $1.69).

    Judging from its P/E alone, Baidu is clearly "priced for even higher perfection" than Google. But when we bring longer-term growth into the equation, a different picture emerges. Based on analysts' estimated 5-year earnings growth of 31% for Google and 63% for Baidu, and working with the 2007 forward P/E figures above, we have PEG ratios of 1.1 for Google and a lower 0.8 for Baidu. Upshot: Judging from PEG, Baidu is actually somewhat cheaper than Google.

    A few historical financials can help us make an intelligent guess about where Baidu's share price may be heading and just how rapidly. As the graph to the right shows, Google's year-on-year revenue growth has slowed from around 160% in 2004Q1 to the still very respectable 70% reported for 2006Q3. Baidu's revenue growth rides on a substantially higher tier than Google's, having floated in the 170% to 200% range for the past five quarters. Two inferences into Baidu's financial future seem reasonable: a) Conservative: Baidu is about two to three years "younger" than Google, and its growth rate should fall to around 70% sometime around 2008 or 2009; or b) More Aggressive: Baidu's growth rate will remain in the low triple digits (100% to 150%) for at least the next couple of years, driven by both macroeconomic (China's rapid economic growth, massive rural-to-urban migration, stimulus from the upcoming Beijing Summer Olympics) and industry-specific (Baidu's #1 traffic ranking in China, dominant search market share, related product launches) factors.

    Both Google and Baidu currently sport healthy net profit margins of around 25% to 30% (see graph). To get a sense of its share growth potential, let's assume that Baidu's profit margins stay where they are, maintained by sufficient R&D spending, with revenue growth being the primary driver of share price over the next few years. Here's how our two scenarios play out:

    a) Conservative: Baidu's revenue growth gradually slows from 170% to 70% over the next two years. Annualized revenue advances four-fold from $120 million (based on analysts' estimate of $30 million for 2006Q3) to around $500 million by 2008Q3 (the quarter of the Beijing Summer Olympics). At a 2008Q3 price-to-sales multiple of 13 (equivalent to Google's P/S ratio today, $140 billion/$11 billion), this puts Baidu at a two-year forward valuation of $6.5 billion.

    b) More Aggressive: If the market opportunity in China allows Baidu's revenue growth to remain in the 100% to 150% range for at least the next two years, we can expect up to a six-fold increase in annualized revenue to around $700 million by 2008Q3 (still a paltry 6% of Google's current $11 billion annualized revenue stream!). At the same P/S multiple of 13 used above, Baidu's two-year forward valuation would reach $9 billion. However, if Baidu's revenue growth is still hovering around 100% two years from now, the P/S multiple will likely sit higher, somewhere between Google's current 13 (at 70% revenue growth) and Baidu's 24 ($2.9 billion/$120 million, at 170% revenue growth). A mid-range P/S multiple of 18 would indicate a two-year forward valuation of $13 billion.

    This quick analysis indicates how Baidu's valuation has the potential to rise from $2.9 billion today to the $6.5 billion to $13 billion range in the next couple of years. Allowing for moderate dilution from stock option exercise, we're looking at the real possibility of a very respectable two- to four-bagger performance by the end of 2008.

    Of course, there's potential downside, too--from regulatory risk, music copyright litigation, click fraud accusations, competitive pressures, changing consumer habits, economic recession, etc. However, I think the potential upside is juicy enough to justify buying at least a toehold into the Baidu opportunity (Disclosure: I've recently taken a long position). The shares are now "seasoned" following their August 2005 IPO and the company's five-quarter reporting history gives future projections a sounder footing. At last Friday's close of $87, Baidu's shares are more expensive than they were at their February price-bottom of $45; yet they are also a lot cheaper than they were at their $154 intra-day price peak the day after the IPO.

    Given Baidu's growing Chinese search market share and noting just how negative Wall Street analysts presently are on Baidu (current ratings: Google 1.9 (buy) vs. Baidu 3.1 (neutral)), I expect Baidu's earnings numbers easily to surpass analysts' expectations (EPS of $0.26 on $30 million revenue) when the company reports 2006Q3 results on October 31. During the conference call, it will also be interesting to listen for commentary on how Baidu is progressing on its new initiatives: the MTV video distribution alliance announced last week (can popularity of YouTube-style apps for China be far away?), Baidu's collaboration with HP on preloaded search, Baidu Space (a blogging site) launched in July, and Baidupedia (like Wikipedia) launched earlier this year. All of these initiatives complement Baidu's core search and established, "sticky," community-oriented services such as popular Baidu Post Bar (a message board hang-out similar in some ways to Technorati) and Baidu Knows (similar to and launched before Yahoo Answers).

    If you overslept the morning the "Google express" left Silicon Valley Station two years ago, don't fret, for it's probably not too late to jump aboard the "Baidu express" while you still can. As I mentioned in a traffic ranking review early last year (incidentally, Baidu has advanced from #6 at that time to #4 today in Alexa's Global Top 500 ranking, now behind only Yahoo, MSN and Google), search remains the rising star of the Internet. In my opinion, there is no company better positioned today than Baidu to harvest the seemingly boundless growth potential the Chinese market offers. (Here's a recent article for further background reading on Baidu.)

    By listening carefully, you should be able to hear Baidu's "little engine that could" chugging along on the fast track with its wheels humming "Do buy Baidu, do buy Baidu, do buy Baidu. . . ." All aboard!

    Wednesday, October 04, 2006

    Net Worth Ranking: Traversing the "Data Desert" Between the Forbes 400 and the Fed Survey

    (Image Credit: istockphoto.com)

    Real estate has been on a remarkable multi-year bull run, and the Dow reached an all-time high this week. Given this market strength, it's not surprising that the cut-off for making the Forbes 400 list of America's wealthiest this year, for the first time, is a billion dollars. With the U.S. population near the 300 million mark and the size of the average household being 2.6 people, there are approximately 115 million households, which means that the statistical likelihood of having your name on the rarified Forbes list is a mere one part in 300,000. Hmmm, what a longshot, right? Reading about billionaires makes us all feel a little poorer. . . .

    But let's try from another perspective: The triennial Federal Reserve Survey of Consumer Finances reports on the net worth of U.S. households in the "mid-range" between the 25th and 90th percentiles. In the most recent survey (2004), the 90th percentile of household net worth was $832,000. By extrapolating results of the survey using a growth rate of 6.6% (which is the CAGR of 90th percentile net worth for the nine-year period between the 1995 and 2004 surveys), we can estimate 90th percentile net worth in 2006 to be $944,000, i.e., close to a million dollars. Since many (if not most) of you reading this already are (or I imagine will soon become) one of the "millionaires next-door," you probably sit in the top 10% of Americans as measured by net worth. In other words, you would be among those receiving an "A" grade if life were a hands-on class in net worth maximization.

    Though you might be in the top decile (i.e., you're one among 11.5 million households!) by net worth, privately you may be still wondering just how wealthy you really are compared to the many millions of other "millionaire" households across America. Surely, in the "data desert" between the $1 million threshold of 90th percentile wealth in the Fed report and the $1 billion cut-off for stratospheric Forbes 400 status, there's a vast expanse--a factor of one thousand to be exact!

    A quick and easy way to interpolate the wealth distribution in the zone between the Federal Reserve and Forbes studies is to use a simple "power law" model :

    Net Worth/(Forbes 400 threshold net worth) = (Rank/400)-a,

    where Rank runs from 400 to 103.5 million (90th percentile out of 115 million households) and "-a" is the exponent of the power law.

    On a log-log plot, the above relationship becomes linear in a:

    Log(Net Worth) = Log($1 billion) - a x [Log(Rank) - Log(400)]

    Using the Federal Reserve 90th percentile point (Rank = 11.5 million, Net Worth = $944,000) to determine the coefficient a = 0.6785, we can solve for Rank and rewrite the equation as:

    Rank = 400 x [$1 billion/Net Worth](1/0.6785)

    For example, a household net worth of $10 million corresponds to a rank of about 350,000, meaning that approximately one in 320 households (99.7th percentile) is worth $10 million or more. At a net worth of $100 million, the rank becomes about 12,000, i.e., just one in 9,700 households (99.99th percentile) have $100 million.

    If you are curious to find out where you sit, go ahead and plug your own net worth into the Rank equation to determine your ranking amongst all 115 million American households. Alternatively, you may find it easier to refer to the graph and table below to obtain a quick feel for your relative ranking.


    Monday, October 02, 2006

    PublicUI: An Opportunity to Share What You Know to Help Organize Our Online World


    To those who have asked why I haven't been blogging for the past few months, here's my excuse: I have been fully occupied developing a new website called PublicUI (http://www.publicui.com/). This venture, now in beta and open to the general public, is my small contribution to Web 2.0. As a people-focussed place "about everyone, by everyone," PublicUI provides a freely accessible platform for collaborative profile-building and commentary. Anyone may initiate, contribute to and edit profiles of anyone else--all without having to register and log in beforehand.

    A quick comparison to well-known websites helps characterize the uniqueness of PublicUI: Your PublicUI user experience begins with a search (like Google), but employs metasearch to generate both text and image results from the major search engines (currently, Google, Yahoo and MSN). After searching on a person's name, you may select relevant search results and go view the corresponding profile (profiles on PublicUI are as central as on MySpace, but favor real names over screen names). You may proceed to enter "tag" words or phrases (as on Flickr) to help describe and distinguish people, along with names of friends and acquaintances, pictures, and additional web links. You may also post comments, messages and opinions on the message board in anyone's profile. Because all users have unrestricted editorial privileges (similar to Wikipedia), PublicUI is 100% user-driven and self-policing (as is Craigslist).

    To my knowledge, PublicUI is the first and only website that allows everyone to contribute information about everyone (i.e., not only about oneself), and anyone to edit anyone's (i.e., not only one's own) profile. A few ways you may find PublicUI useful are:

    1. To Organize Information About People: Share public information about people you know (or know of) for the mutual benefit of everyone, and help edit people's profiles to organize the increasing abundance of information about all of us available across the Internet;

    2. To Build Profiles of Yourself and Others: Creating a PublicUI profile is easy. Just search on your own name to get started. Select relevant text and images from among the search results that come up if you already have a web presence; upload a few pictures of yourself if you do not. Either way, be sure to add some distinguishing tags and names of friends to fill out your profile. After starting your own profile, you may wish to initiate profiles of your friends, acquaintances and anyone else you have heard about in the news or elsewhere;

    3. To Communicate with Others: Once you and people you know have profiles, the power of the social network begins to reveal itself. As more people you know become active contributors of content, your PublicUI experience will become increasingly more interesting and rewarding. Encourage some friends to participate. Try leaving brief messages for people or posting general, publicly acceptable comments about people on their message boards.

    Lest we stray too far afield in this investing blog, please rest assured that PublicUI pertains as well to the financial world as to any other social niche. To explore the site, you may wish to have a look at a few of the PublicUI profiles of prominent investors, entrepreneurs and financial gurus already in the database: Warren Buffett, George Soros, Sheldon Adelson, Peter Lynch, Jeremy Siegel, . . . . Please feel free to help edit these or any other profiles as you deem appropriate, and don't forget to add your own profile to the mix!

    If you would like to share your thoughts about PublicUI, please post a brief comment in the message board section of my PublicUI profile page. Thanks.