Technology Stocks: The Second Coming
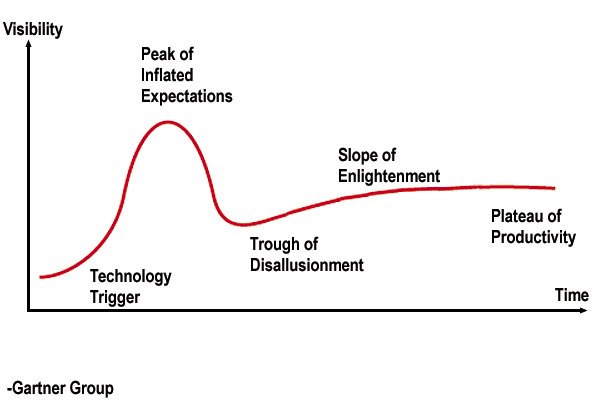
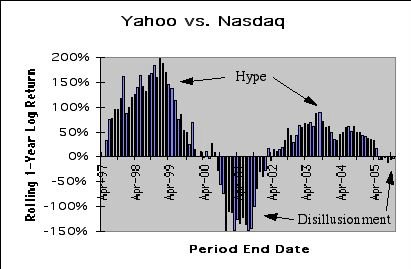
Back in 1985, the CEO of the investment bank where I worked had a saying, "What goes around comes around," recognizing that markets, profits and even life's good fortune all go in cycles. During the downturn of Southern California real estate in the early 1990s, the slogan among die-hards was "Stay alive till '95," though actual recovery of property prices took longer than anticipated. Price swings of the Nasdaq, too, exhibit a cycle: Following a lengthy bull market culminating with Internet stock overindulgence at a lofty peak of 5049 in March 2000, the Nasdaq plummeted and bottomed at 1114 in October 2002. Now trading at 2260, the Nasdaq has doubled from its nadir but still trades at less than half its all-time high.
Today, with the prolonged bull market in residential real estate growing tired, the bond market moving sideways, and soaring energy prices struggling to break new ground, technology stocks look like a relatively attractive place to park one's money. Let's consider the basic drivers favoring a Nasdaq resurgence:
Fundamentals
Based on price-to-earnings and price-to-sales ratios, the valuation of leading Nasdaq companies has returned to normal levels following the tech bubble of 2000. The radar charts below show how both P/E and P/S ratios have contracted to where they were around 1996, before the Internet became a household word:
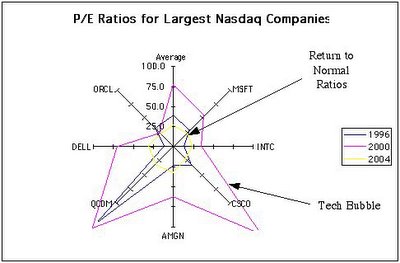
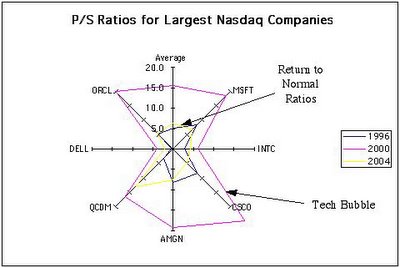
The average P/E ratio of the seven largest Nasdaq stocks by current market capitalization (Microsoft (MSFT), Intel (INTC), Cisco (CSCO), Amgen (AMGN), Qualcomm (QCOM), Dell (DELL) and Oracle (ORCL)--omitting Google (GOOG) because of its limited public trading history) rose from 39 in 1996 to a stratospheric 77 in 2000, and fell all the way back down to 27 by 2004. Similarly, the average P/S ratio went from 5.2 in 1996 to a high 15.6 in 2000, and reverted to 6.3 in 2004.
Anecdotally, with so many new technology initiatives--Web 2.0, tagging (del.icio.us and flickr), Internet telephony (Skype), IPTV, BitTorrent movie downloads, blogging and now vlogging--2005 is a bit like the mid-1990s all over again. Around every corner there are plenty of opportunities for both new and existing companies to innovate and identify profitable niches as technology and consumer preferences rapidly evolve.
A Technical Indicator
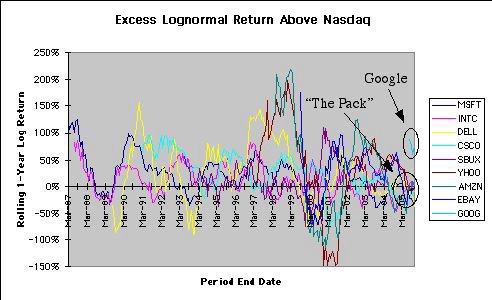
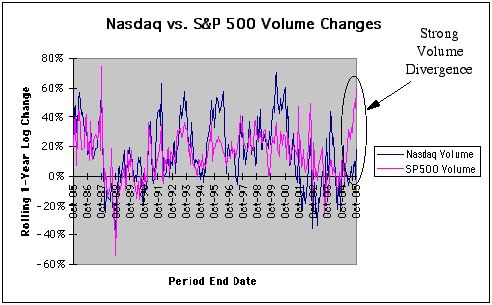
Further evidence for a possible rally in technology stocks comes from a comparison of historical price and volume data between the tech-laden Nasdaq and the broader-based S&P 500. The graphs below show a tight correlation (correl. = 0.84) in historical price performance between the two indices. Volume changes show lower though still significant correlation (correl. = 0.66):
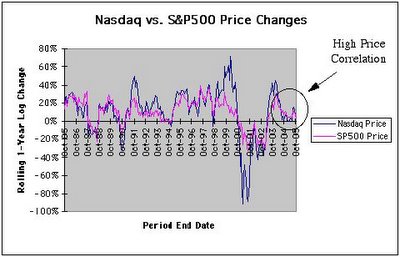
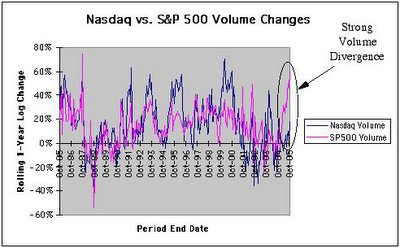
Interestingly, during the past year, there has been a notable divergence in volume patterns, with S&P 500 volume rising sharply from levels in 2004, while Nasdaq trading volume has remained more or less unchanged from the prior year. Compared to historical behavior over the past twenty years, this recent divergence in volume patterns is clearly abnormal. I suspect that sometime during the upcoming year the markets will see convergence, with Nasdaq volume rising to "catch up" with S&P 500 volume. Because the Nasdaq tends to have higher volatility than the S&P 500, a surge in volume could also accompany a rise in the Nasdaq price index relative to the S&P 500, with tech stocks leading the way.
Some Sentiment
Because psychological factors drive overshooting and undershooting of prices, general market sentiment is also a vital sign of market direction. Recent news of George Soros betting more than $2 billion on big-cap old-tech stocks (IBM, Apple, Microsoft, Intel and Amazon) is an indication that technology is again in vogue at least with some representative old-economy veterans (smart money?) having deep pockets. With Bill Gates now on Berkshire Hathaway's board of directors and his growing friendship with Warren Buffett, one wonders when the Oracle of Omaha will, if ever, begin to deploy even a modest amount of his cash stockpile into technology investing. Buffett claims to avoid tech stocks because he has no competitive edge in this area, but we should recall that he also had shied away from buying foreign stocks for his entire 40-year investing career until 2002 when he waded into PetroChina.
Market timing is always tricky business. However, taking advantage of 20/20 hindsight, we know that on the 12-hour timing clock the hour hand pointed to high noon (12 o'clock) during 2000 and bounced off the 6 o'clock bottom during 2002. With bull markets typically more extended in years than bear markets, just as recessions tend to be much shorter-lived than economic expansions, my guess is that we are now somewhere around 9 o'clock with a great deal of upside ahead of us. Further, relatively speaking based on fundamentals, technicals and sentiment, it looks like technology stocks should outperform the broader market over the next few years.
Today, with the prolonged bull market in residential real estate growing tired, the bond market moving sideways, and soaring energy prices struggling to break new ground, technology stocks look like a relatively attractive place to park one's money. Let's consider the basic drivers favoring a Nasdaq resurgence:
Fundamentals
Based on price-to-earnings and price-to-sales ratios, the valuation of leading Nasdaq companies has returned to normal levels following the tech bubble of 2000. The radar charts below show how both P/E and P/S ratios have contracted to where they were around 1996, before the Internet became a household word:

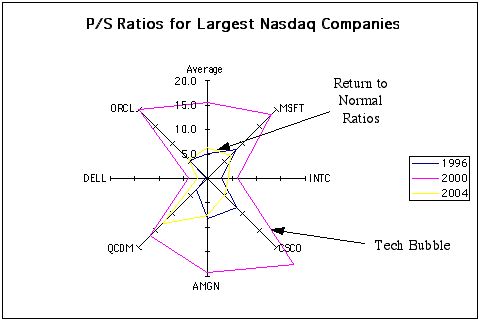
The average P/E ratio of the seven largest Nasdaq stocks by current market capitalization (Microsoft (MSFT), Intel (INTC), Cisco (CSCO), Amgen (AMGN), Qualcomm (QCOM), Dell (DELL) and Oracle (ORCL)--omitting Google (GOOG) because of its limited public trading history) rose from 39 in 1996 to a stratospheric 77 in 2000, and fell all the way back down to 27 by 2004. Similarly, the average P/S ratio went from 5.2 in 1996 to a high 15.6 in 2000, and reverted to 6.3 in 2004.
Anecdotally, with so many new technology initiatives--Web 2.0, tagging (del.icio.us and flickr), Internet telephony (Skype), IPTV, BitTorrent movie downloads, blogging and now vlogging--2005 is a bit like the mid-1990s all over again. Around every corner there are plenty of opportunities for both new and existing companies to innovate and identify profitable niches as technology and consumer preferences rapidly evolve.
A Technical Indicator
Further evidence for a possible rally in technology stocks comes from a comparison of historical price and volume data between the tech-laden Nasdaq and the broader-based S&P 500. The graphs below show a tight correlation (correl. = 0.84) in historical price performance between the two indices. Volume changes show lower though still significant correlation (correl. = 0.66):

Interestingly, during the past year, there has been a notable divergence in volume patterns, with S&P 500 volume rising sharply from levels in 2004, while Nasdaq trading volume has remained more or less unchanged from the prior year. Compared to historical behavior over the past twenty years, this recent divergence in volume patterns is clearly abnormal. I suspect that sometime during the upcoming year the markets will see convergence, with Nasdaq volume rising to "catch up" with S&P 500 volume. Because the Nasdaq tends to have higher volatility than the S&P 500, a surge in volume could also accompany a rise in the Nasdaq price index relative to the S&P 500, with tech stocks leading the way.
Some Sentiment
Because psychological factors drive overshooting and undershooting of prices, general market sentiment is also a vital sign of market direction. Recent news of George Soros betting more than $2 billion on big-cap old-tech stocks (IBM, Apple, Microsoft, Intel and Amazon) is an indication that technology is again in vogue at least with some representative old-economy veterans (smart money?) having deep pockets. With Bill Gates now on Berkshire Hathaway's board of directors and his growing friendship with Warren Buffett, one wonders when the Oracle of Omaha will, if ever, begin to deploy even a modest amount of his cash stockpile into technology investing. Buffett claims to avoid tech stocks because he has no competitive edge in this area, but we should recall that he also had shied away from buying foreign stocks for his entire 40-year investing career until 2002 when he waded into PetroChina.
Market timing is always tricky business. However, taking advantage of 20/20 hindsight, we know that on the 12-hour timing clock the hour hand pointed to high noon (12 o'clock) during 2000 and bounced off the 6 o'clock bottom during 2002. With bull markets typically more extended in years than bear markets, just as recessions tend to be much shorter-lived than economic expansions, my guess is that we are now somewhere around 9 o'clock with a great deal of upside ahead of us. Further, relatively speaking based on fundamentals, technicals and sentiment, it looks like technology stocks should outperform the broader market over the next few years.
posted by Lloyd Sakazaki at 6:01 AM
2 comments
![]()
![]()