Friday, November 25, 2005

Technology Stocks: The Second Coming

Back in 1985, the CEO of the investment bank where I worked had a saying, "What goes around comes around," recognizing that markets, profits and even life's good fortune all go in cycles. During the downturn of Southern California real estate in the early 1990s, the slogan among die-hards was "Stay alive till '95," though actual recovery of property prices took longer than anticipated. Price swings of the Nasdaq, too, exhibit a cycle: Following a lengthy bull market culminating with Internet stock overindulgence at a lofty peak of 5049 in March 2000, the Nasdaq plummeted and bottomed at 1114 in October 2002. Now trading at 2260, the Nasdaq has doubled from its nadir but still trades at less than half its all-time high.

Today, with the prolonged bull market in residential real estate growing tired, the bond market moving sideways, and soaring energy prices struggling to break new ground, technology stocks look like a relatively attractive place to park one's money. Let's consider the basic drivers favoring a Nasdaq resurgence:

Fundamentals

Based on price-to-earnings and price-to-sales ratios, the valuation of leading Nasdaq companies has returned to normal levels following the tech bubble of 2000. The radar charts below show how both P/E and P/S ratios have contracted to where they were around 1996, before the Internet became a household word:
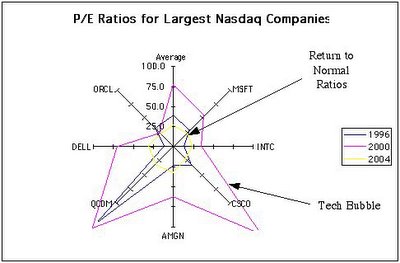
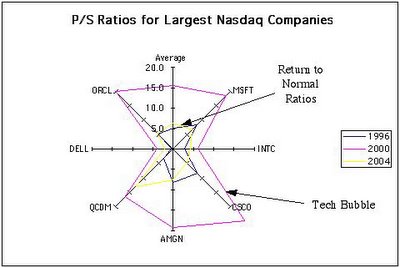


The average P/E ratio of the seven largest Nasdaq stocks by current market capitalization (Microsoft (MSFT), Intel (INTC), Cisco (CSCO), Amgen (AMGN), Qualcomm (QCOM), Dell (DELL) and Oracle (ORCL)--omitting Google (GOOG) because of its limited public trading history) rose from 39 in 1996 to a stratospheric 77 in 2000, and fell all the way back down to 27 by 2004. Similarly, the average P/S ratio went from 5.2 in 1996 to a high 15.6 in 2000, and reverted to 6.3 in 2004.

Anecdotally, with so many new technology initiatives--Web 2.0, tagging (del.icio.us and flickr), Internet telephony (Skype), IPTV, BitTorrent movie downloads, blogging and now vlogging--2005 is a bit like the mid-1990s all over again. Around every corner there are plenty of opportunities for both new and existing companies to innovate and identify profitable niches as technology and consumer preferences rapidly evolve.

A Technical Indicator

Further evidence for a possible rally in technology stocks comes from a comparison of historical price and volume data between the tech-laden Nasdaq and the broader-based S&P 500. The graphs below show a tight correlation (correl. = 0.84) in historical price performance between the two indices. Volume changes show lower though still significant correlation (correl. = 0.66):

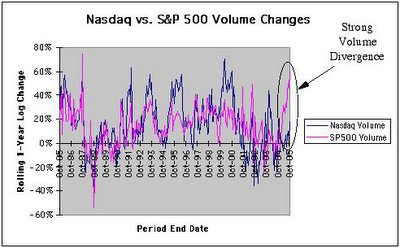


Interestingly, during the past year, there has been a notable divergence in volume patterns, with S&P 500 volume rising sharply from levels in 2004, while Nasdaq trading volume has remained more or less unchanged from the prior year. Compared to historical behavior over the past twenty years, this recent divergence in volume patterns is clearly abnormal. I suspect that sometime during the upcoming year the markets will see convergence, with Nasdaq volume rising to "catch up" with S&P 500 volume. Because the Nasdaq tends to have higher volatility than the S&P 500, a surge in volume could also accompany a rise in the Nasdaq price index relative to the S&P 500, with tech stocks leading the way.

Some Sentiment

Because psychological factors drive overshooting and undershooting of prices, general market sentiment is also a vital sign of market direction. Recent news of George Soros betting more than $2 billion on big-cap old-tech stocks (IBM, Apple, Microsoft, Intel and Amazon) is an indication that technology is again in vogue at least with some representative old-economy veterans (smart money?) having deep pockets. With Bill Gates now on Berkshire Hathaway's board of directors and his growing friendship with Warren Buffett, one wonders when the Oracle of Omaha will, if ever, begin to deploy even a modest amount of his cash stockpile into technology investing. Buffett claims to avoid tech stocks because he has no competitive edge in this area, but we should recall that he also had shied away from buying foreign stocks for his entire 40-year investing career until 2002 when he waded into PetroChina.

Market timing is always tricky business. However, taking advantage of 20/20 hindsight, we know that on the 12-hour timing clock the hour hand pointed to high noon (12 o'clock) during 2000 and bounced off the 6 o'clock bottom during 2002. With bull markets typically more extended in years than bear markets, just as recessions tend to be much shorter-lived than economic expansions, my guess is that we are now somewhere around 9 o'clock with a great deal of upside ahead of us. Further, relatively speaking based on fundamentals, technicals and sentiment, it looks like technology stocks should outperform the broader market over the next few years.
Friday, November 11, 2005

For How Long Can Google Run Ahead of the Pack?

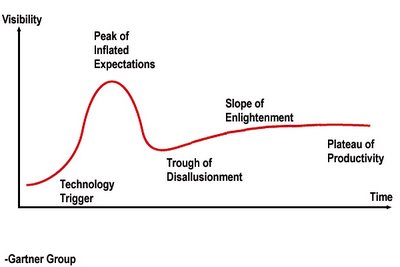
I came across the Gartner Group's "technology bubble" graph recently, sketching how "hype cycles" work:

1. A new technology reaches the market;
2. People's expectations become overly inflated as the technology is hyped;
3. Disillusionment soon sets in when we realize the limitations of the technology;
4. Ultimately, we are "enlightened" and reach a plateau of productivity.


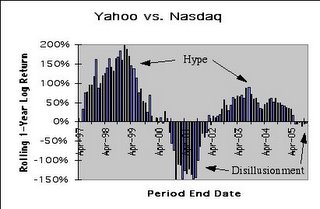
This type of overinflated expectations behavior can readily be seen in the stock market. A textbook example is Yahoo's stock price from its IPO in 1996, through the Internet stock craze of 1999, collapse of the bubble in 2000-2001, and more realistic expectations from 2002 onward:


To highlight the hype-disillusionment cycles embedded in the price information, I apply a three-part transformation to the raw data:
  • Look at annual returns using a rolling 12-month observation window to "smooth out" short-term volatility;
  • Use a lognormal scale [Lognormal Return = ln(1 + Ordinary Return)] to display upside and downside more symmetrically;
  • Calculate excess returns above the Nasdaq stock index to gauge individual stock outperformance.
The chart for Yahoo then becomes:


The lognormal excess return chart exhibits how the hype-disillusionment cycle repeats itself over time. These recurring cycles are more apparent in the price charts of stocks having longer trading histories, such as Microsoft's beginning with its IPO in 1986:


In the stock market, the mechanism underlying hype-disillusionment cycles is none other than what Ben Graham pointed out more than a half a century ago with his discussion of Mr. Market, whose emotions run from being overly enthusiastic one day to gloomy and depressed another day.

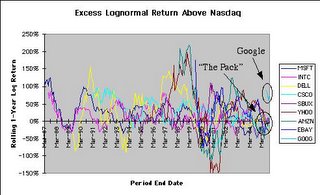
Following Google's IPO in August 2004, where in its own hype-disillusionment cycle does the company sit today? Due to its limited history as a public company, Google's cycle is difficult to quantify. However, a look at Google in relation to other Nasdaq companies provides some useful intuition:


Chronologically from the dates of their IPOs, these Nasdaq market leaders have given us:
  • Microsoft (1986): Windows operating system and Office productivity applications
  • Intel (1986): Chips to run the software
  • Dell (1988): Affordable PCs for everyone
  • Cisco (1990): Networking equipment for the Internet
  • Starbucks (1992): (To round out the online experience) Coffee, couches and conversation
  • Yahoo (1996): Content with a human touch and sense of online community
  • Amazon (1997): More than just books--the Wal-Mart of the web
  • eBay (1998): Auctions allowing anyone to sell anything
  • Google (2004): Clean, fast, automated, algorithmic search
Clearly, with the many technologies and sub-worlds--hardware and software, computer and network, offline and online experience, human and machine, fixed-price and auction shopping, corporate and user-generated content--being so intertwined, no single company can exist in isolation.

As the comparative return graph indicates, among these companies, only Google has been so dramatically outperforming the Nasdaq over the past year. Based on the long history of hype-disillusionment cycles of all of the market leaders, we can be fairly certain that underperformance at Google will too (like night follows day) one day come. Personally, I would bet on convergence between Google and "the pack" of market leaders before becoming too carried away with notions of brilliant Ph.D. researchers leveraging algorithmic search to leapfrog into mainstream advertising, journalism, shopping and the like.

Saturday, November 05, 2005

Evidence for NOT Listening to Equity Analysts

Back in February, I posted consensus one-year price targets of equity analysts for individual stocks in the Nasdaq 100. Today I resume this study to see if the analysts' targets have had any predictive value.

The table below compares equity analysts' price targets from February with the actual resulting stock price performance over the past nine months:

Company (Ticker): Expected % Price Change, Actual % Price Change
(For the approx. 9-month period from 18-Feb-05 to 04-Nov-05)

Stocks Expected to Perform BEST:
JDS Uniphase (JDSU): 31%, 28%
Sanmina-SCI (SANM): 31%, -26%
Career Education (CECO): 30%, -6%
IAC Interactive (IACI): 30%, -39%
Millennium Pharm. (MLNM): 29%, 9%
ATI Technologies (ATYT): 28%, -12%
Juniper Networks (JNPR): 28%, 9%
Cisco Systems (CSCO): 26%, 2%
Symantec (SYMC): 20%, -16%
Dollar Tree Stores (DLTR): 20%, -9%

Stocks Expected to Perform WORST:
Level 3 Comm. (LVLT): -37%, 53%
Patterson Companies (PDCO): -12%, -13%
Marvell Tech (MRVL): -10%, 31%
Pixar (PIXR): -8%, 20%
MCI (MCIP): -8%, -10%
Whole Foods (WFMI): -7%, 47%
Apple Comp. (AAPL): -1%, 41%
K-Mart (KMRT): 0%, 23%
Electronic Arts (ERTS): 0%, -7%
QLogic (QLGC): 1%, -26%

Taking averages over the 10 stocks in each subgroup, we have:

Stocks Expected to Perform BEST:
EXPECTED average price change: 27%
ACTUAL average price change: -6%

Stocks Expected to Perform WORST:
EXPECTED average price change: -8%
ACTUAL average price change: 16%

If an investor had bought the equity analysts' top 10 picks (as gauged by highest expected one-year price change), he would have lost 6%. On the other hand, if the investor had adopted a contrarian view and bought the 10 stocks expected by equity analysts to perform worst, he would have gained 16%! In other words, over the past nine months the equity analysts' price targets have been a contra-indicator of actual performance. (To verify that this result holds more broadly, I have applied the same analysis to all 100 stocks in the Nasdaq 100 and found the correlation between expected and actual price performance to be -0.21.)

These results, indicating the absence of clairvoyant stock picking prowess among equity analysts, are perhaps as anticipated, since, after all, if equity analysts really were good stock pickers, they would all be investors rather than analysts, right? Anyway, for what it's worth, if anyone has interest in seeing current consensus targets, either to side with the analysts or to take a contranian view, here they are:

(Based on 04-Nov-2005 closing prices)

Company (Ticker): Current Stock Price, Expected 1-Year % Price Change

Stocks Expected to Perform BEST:
Flextronics (FLEX): 9.40, 46%
Wynn Resorts (WYNN): 49.94, 42%
Comcast (CMCSA): 27.14, 40%
Symantec (SYMC): 18.63, 37%
Sears (SHLD): 169.75, 37%
Echostar (DISH): 26.66, 36%
XM Satellite (XMSR): 29.90, 36%
Career Education (CECO): 33.80, 33%
NTL Inc. (NTLI): 59.03, 32%
Research In Motion (RIMM): 62.90, 31%

Stocks Expected to Perform WORST:
Level 3 Comm. (LVLT): 2.92, -66%
JDS Uniphase (JDSU): 2.35, -21%
Sandisk (SNDK): 65.14, -17%
Express Scripts (ESRX): 79.31, -16%
Whole Foods (WFMI): 149.93, -13%
Pixar (PIXR): 54.11, -10%
Siebel Systems (SEBL): 10.42, -9%
Apple Comp. (AAPL): 61.15, -6%
Expeditors International (EXPD): 66.78, -6%
Costco (COST): 49.12, -5%

I close with a couple of observations:

1. Versus nine months ago, the analysts are showing a noticeable degree of continuity of opinion: Symantec and Career Education remain among the top-10 favorites of the analysts, while Level 3 Comm., Whole Foods, Pixar and Apple Comp. remain in the bottom-10 dogpile. Interestingly, however, JDS Uniphase and Sears (was K-Mart) have flip-flopped between favorites list and dogpile;

2. Among the particular stocks mentioned in paragraph 1 above, the only one whose price movement the analysts "predicted" correctly ("guessed" is probably the more suitable term here!) was JDS Uniphase (31% expected vs. 28% actual). For all of the other names, the analysts didn't even get the direction of price movement correct!

I'll try to remember to have look in about a year's time to see how the equity analysts do this time around . . . .

Thursday, November 03, 2005

Office REITs: Fill 'er Up, Please!

Two very bullish articles about the Seattle area office and apartment market have appeared this week in my local paper. One reviews how Equity Office (and other office property owners) have benefited from local job growth since 2002, which has pounded office vacancy rates from a high of 30% all the way down to 8% in Bellevue on the Eastside of the Seattle metro. The other indicates how buyers are now chasing Seattle area apartment investments, in anticipation of rising rents as the apartment sector joins the local economic recovery. Clearly, fundamentals are strengthening, providing further support for rising asset prices.

Among the fundamental indicators in investment real estate, occupancy is perhaps simplest to track and easiest to interpret. With a "natural" 5% vacancy rate expected from normal tenant mobility, occupancy above 95% typically means that rents have room to rise. In the opposite direction, occupancy below 90% is a tell-tale sign of a very weak rental market.

A few years ago, in the middle of the dot-com doldrums which elevated nationwide office vacancy rates into the teens, I took long-term positions in a couple of office REITs (disclosure: I am long Equity Office and Trizec), expecting to see improvement over a five- to ten-year horizon as the market cycle runs its course. Below is a summary tracking annual occupancy rates of the top three REITs (by market capitalization) in the office and apartment sectors:

The table shows occupancy percentages for the years indicated. (Source: Company 10-Ks and 10-Qs)

Name (Ticker, Market Cap): 1999, 2000, 2001, 2002, 2003, 2004, 2005Q3

Office REITs:
Equity Office (EOP, $12.5 bil.): 93.7, 94.6, 91.8, 88.6, 86.3, 87.7, 89.3
Boston Properties (BXP, $7.6 bil.): 98.4, 98.9, 95.3, 93.9, 92.1, 92.1, 93.3
Trizec Properties (TRZ, $3.4 bil.): 91.4, 94.2, 94.3, 89.0, 86.6, 89.5, 88.0

Apartment REITs:
Equity Residential (EQR, $11.0 bil.): 95.1, 94.9, 94.4, 93.7, 93.0, 93.3, 94.7
Archstone (ASN, $8.1 bil.): 94.9, 96.1, 94.7, 94.6, 94.4, 94.9, 96.0
Avalon Bay (AVB, $6.3 bil.): 96.6, 97.6, 95.4, 93.6, 93.8, 95.3, 95.9

The occupancy data illustrate three of the four stages in a typical real estate cycle:

1. Overshooting: In 1999-2000, both office and apartment occupancy rates peaked in the 95% to 98% range, driven by the notable strength of the tech-driven economy in its heyday.

2. Contraction: From 2001 to 2003, office occupancy plummeted to the 86% to 92% range as many dot-com companies cancelled leases. Falling apartment occupancy is discernible but much more muted in the numbers due to the cushioning impact of short-term leases and rent concessions.

3. Recovery: During 2004, occupancy began to improve gradually. Office occupancy is now in the 89% to 93% range, and apartment occupancy has returned to a normal market range of 94% to 96%.

What ought to come next is the growth stage:

4. Growth: I expect that during 2006 and continuing for a few years, we will see further improvement in office and apartment fundamentals. Office occupancy should return to the 95% level, thereafter supporting a rise in rents. With less volatile apartment occupancy already back to around 95%, improving fundamentals should soon be reflected in higher rents.

Potential detractors from this growth scenario are rising interest rates, rising energy prices and eroding consumer confidence--all of which could lead to slower job creation, hence delayed occupancy growth. Caveats aside, though, I believe that the office sector is poised for further improvement in occupancy. In particular, following the recent selloff after 2005Q3 earnings which came in slightly below analysts' estimates, two of the large office REITs--Equity Office and Trizec--appear to have good upside potential at this point.

Tuesday, November 01, 2005

How "Internet Advertising" Becomes an Oxymoron in an Entangled Everyone-to-Everyone Network

Google's meteoric rise on the coattails of its newfound business model--algorithmically optimized pay-per-clickthrough advertising in a search-relevant context--is eyepopping for Wall Street investors, Main Street executives and Madison Avenue advertising firms alike. I applaud the company's focus on steering engineering and science talent into creating an expansive list of innovative applications, but at the same time I sense an ominous cloud being stirred by foreboding winds on the horizon. In this post, I explain what I see as the beginning of an oxymoronic disconnect in the term "Internet advertising," being driven by a broader trend that will have disruptive implications on who profits from the Internet.

The key idea is the network: In the 1980s, Microsoft and Intel brought us PCs, and in the 1990s, Cisco gave us the routers and networking hardware to tie our PCs together. This laid the physical foundation of the network that enables us the communicate "over the Internet." Riding on top of this physical network, all participants--large corporations, smaller merchants and consumers--become "nodes" connected to one another through an increasingly intricate web of "links."

Based on the state of the Internet today, we can classify the market leaders in a network context by looking at the business models of their core competencies (defined here as the area from which they derive the bulk of their revenue):

  • Amazon (market cap: $17 bil.): "One-to-many" model of providing a single virtual storefront for many consumers to shop from the convenience of their own homes for books, CDs and so many other products;
  • Yahoo (market cap: $53 bil.): "Few-to-many" model of sourcing traditional content from a few providers and arranging it in a user-friendly way for many users (Note: This is Yahoo's historical core competency; however, Yahoo currently derives more revenue from the many-to-everyone ad model listed beside Google below);
  • eBay (market cap: $56 bil.): "Many-to-many" model of connecting many sellers to many buyers via auctions of used items, new goods and even non-goods;
  • Google (market cap: $106 bil.): "Many-to-everyone" model of selling ads to many merchants, large and small, through placement alongside search results, blogs and other content being viewed by everyone who uses the Internet.

Note the close correlation between market capitalization and effectiveness of business model in exploiting the network to its fullest. Clearly, the many-to-everyone model for distributing ads carries the most value, as evidenced by Google's market cap now in excess of $100 billion.

The sheer number of nodes and links in the overall network is increasing daily as more and more users find their way onto the Internet. Even more importantly, as Internet usage grows, the ratio of links-to-nodes also increases. This "ratio growth" may be viewed as an enabler of new businesses:

  • Sparse network: A low links-to-nodes ratio is sufficient for destination shopping and web surfing. Consumers go to Amazon for books and to Yahoo for news, stock quotes, email, etc.
  • Dense network: A higher links-to-nodes ratio gives eBay its stickiness and high barrier-to-entry, allowing users to connect to one another to buy and sell everything and anything. Google acquires value by serving up ads connecting large and small advertisers to more and more people who use search.

Extending this train of thought, the next logical step of evolutionary development ought to be an entangled everyone-to-everyone network, i.e., a network with a very high links-to-nodes ratio in which everyone is connected to everyone else in a useful, productive way. We can already see aspects of this type of peer-generated content and value emerging in some parts of the services the Internet leaders offer:

Amazon: Book reviews and usefulness ratings by peers
Yahoo: Instant messaging, message boards, groups
eBay: Customer ratings of merchants for self-policing against fraud
Google: Machine learning from URL linkages and user search behavior

In an entangled network, everyone (not just retailers, traditional content providers, merchants and search sites) becomes a producer of content, contributing across a wide spectrum of activities: building websites, blogging, writing reviews, posting comments, sending messages, voting, or merely surfing and searching the web. Through this collective process, peer-generated information, both individually and in aggregate, becomes increasingly valuable--which leads us to an important implication.

When everyone's opinion begins to count, we transition into a world that reveals the quintessential spirit of the Internet--a decentralized, highly interconnected network; a dynamic, level playing field without any controlling nodes. In such a world, corporate advertising pales in importance to peer opinion. Instead of being swayed by corporate-driven unilateral ads, we make our decisions through participating in a peer-to-peer "conversation" in which we share comments, tags, opinions and purchase decisions. Implication: the flatter the network, the less value ads have.

Now, back to Google: How can an ads-based business model survive in a peer-to-peer world where bilateral user opinion counts more than unilateral corporation-to-consumer ads? I cannot predict how many years it will take the Internet to undergo its upcoming irrreversible "phase transition" into an entangled everyone-to-everyone network, but early signs of its coming already lead me to doubt the robustness and longevity of oxymoronic "Internet advertising." Google has done wonders to help us find information on the Internet and is being generously rewarded by the market for its innovation. My guess, though, is that the ads jackpot at the end of the rainbow will look a lot smaller in 20/20 hindsight when we truly become entangled in the everyone-to-everyone network we are all now so busily creating!